

374
20 Wonders of Multifield Lattice Oscillation
20.3 Outline of Experimental Observations
20.3.1 Size Matter—Atomic Undercoordination
The Raman-active modes and the IR-active modes for the sized and the layered
two-dimensional (2-D) structures show different trends of phonon frequency shift
[35–39]:
(1) The transverse and the longitudinal optical (TO/LO) Raman modes shift toward
either lower or higher frequency.
(2) The E 2g mode for WX 2 and TiO 2 and the G mode for graphene undergo blueshift
as the feature size is reduced.
(3) The A 1g mode and the D/2D mode shift to lower frequency when the features
size decreases.
(4) Low-frequency Raman (LFR) acoustic modes emerge at wave numbers of a
few or a few tens cm
−1 , or THz range (~33 cm
−1 ), and this mode undergoes
a blueshift when the feature size is reduced. The LFR disappears at infinitely
large crystal size.
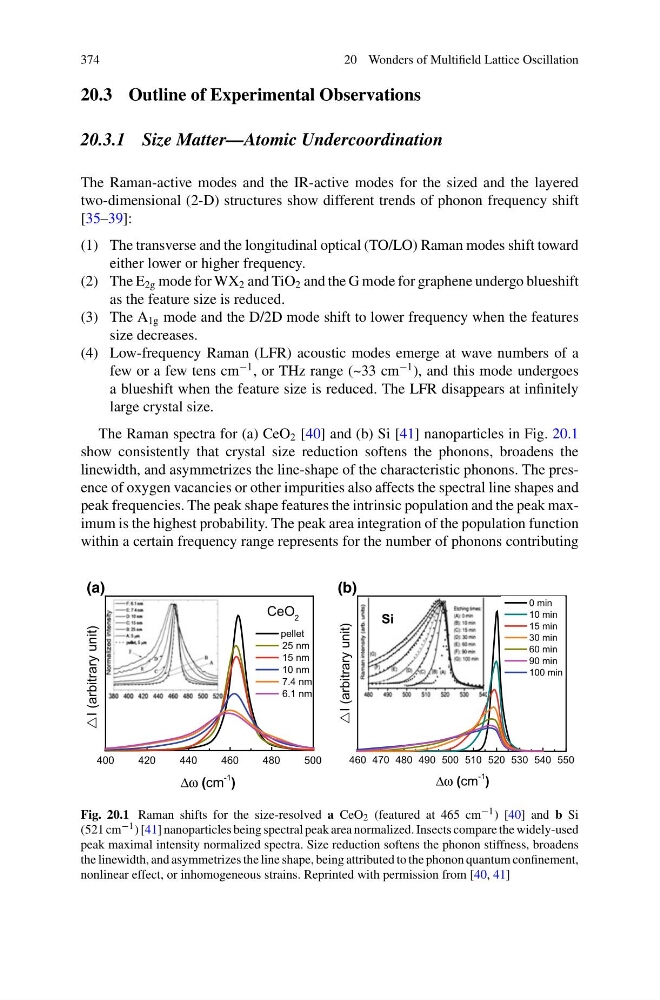
The Raman spectra for (a) CeO 2 [40] and (b) Si [41] nanoparticles in Fig. 20.1
show consistently that crystal size reduction softens the phonons, broadens the
linewidth, and asymmetrizes the line-shape of the characteristic phonons. The presence of oxygen vacancies or other impurities also affects the spectral line shapes and
peak frequencies. The peak shape features the intrinsic population and the peak maximum is the highest probability. The peak area integration of the population function
within a certain frequency range represents for the number of phonons contributing
400
420
440
460
480
500
I (arbitrary unit)
Δω (cm
-1
)
pellet
25 nm
15 nm
10 nm
7.4 nm
6.1 nm
CeO 2
460 470 480 490 500 510 520 530 540 550
I (arbitrary unit)
Δω (cm
-1
)
0 min
10 min
15 min
30 min
60 min
90 min
100 min
Si
(a)
(b)
Fig. 20.1 Raman shifts for the size-resolved a CeO 2 (featured at 465 cm −1 ) [40] and b Si
(521 cm −1 ) [41] nanoparticles being spectral peak area normalized. Insects compare the widely-used
peak maximal intensity normalized spectra. Size reduction softens the phonon stiffness, broadens
the linewidth, and asymmetrizes the line shape, being attributed to the phonon quantum confinement,
nonlinear effect, or inhomogeneous strains. Reprinted with permission from [40, 41]
20 Wonders of Multifield Lattice Oscillation
20.3 Outline of Experimental Observations
20.3.1 Size Matter—Atomic Undercoordination
The Raman-active modes and the IR-active modes for the sized and the layered
two-dimensional (2-D) structures show different trends of phonon frequency shift
[35–39]:
(1) The transverse and the longitudinal optical (TO/LO) Raman modes shift toward
either lower or higher frequency.
(2) The E 2g mode for WX 2 and TiO 2 and the G mode for graphene undergo blueshift
as the feature size is reduced.
(3) The A 1g mode and the D/2D mode shift to lower frequency when the features
size decreases.
(4) Low-frequency Raman (LFR) acoustic modes emerge at wave numbers of a
few or a few tens cm
−1 , or THz range (~33 cm
−1 ), and this mode undergoes
a blueshift when the feature size is reduced. The LFR disappears at infinitely
large crystal size.
The Raman spectra for (a) CeO 2 [40] and (b) Si [41] nanoparticles in Fig. 20.1
show consistently that crystal size reduction softens the phonons, broadens the
linewidth, and asymmetrizes the line-shape of the characteristic phonons. The presence of oxygen vacancies or other impurities also affects the spectral line shapes and
peak frequencies. The peak shape features the intrinsic population and the peak maximum is the highest probability. The peak area integration of the population function
within a certain frequency range represents for the number of phonons contributing
400
420
440
460
480
500
I (arbitrary unit)
Δω (cm
-1
)
pellet
25 nm
15 nm
10 nm
7.4 nm
6.1 nm
CeO 2
460 470 480 490 500 510 520 530 540 550
I (arbitrary unit)
Δω (cm
-1
)
0 min
10 min
15 min
30 min
60 min
90 min
100 min
Si
(a)
(b)
Fig. 20.1 Raman shifts for the size-resolved a CeO 2 (featured at 465 cm −1 ) [40] and b Si
(521 cm −1 ) [41] nanoparticles being spectral peak area normalized. Insects compare the widely-used
peak maximal intensity normalized spectra. Size reduction softens the phonon stiffness, broadens
the linewidth, and asymmetrizes the line shape, being attributed to the phonon quantum confinement,
nonlinear effect, or inhomogeneous strains. Reprinted with permission from [40, 41]