

210
10 Hetero- and Under-Coordination Coupling
1024
1022
1020
1018
Zn 2p 3/2
202 nm
8.5
3.0 nm
8.5 - 202
3.0 - 202
Intensity
BE(eV)
T
P
1024
1022
1020
Zn 2p 3/2
As grown ZnO
O-passivated
Hydrogenated
O - ZnO
H - ZnO
Intensity
BE(eV)
P
T
2.6
2.4
2.2
2.0
1.8
1.6
1.4
202 nm
8.5
3.0
8.5 - 202
3.0 - 202
Intensity
E PL (eV)
P
T
PL
(a)
(b)
(c)
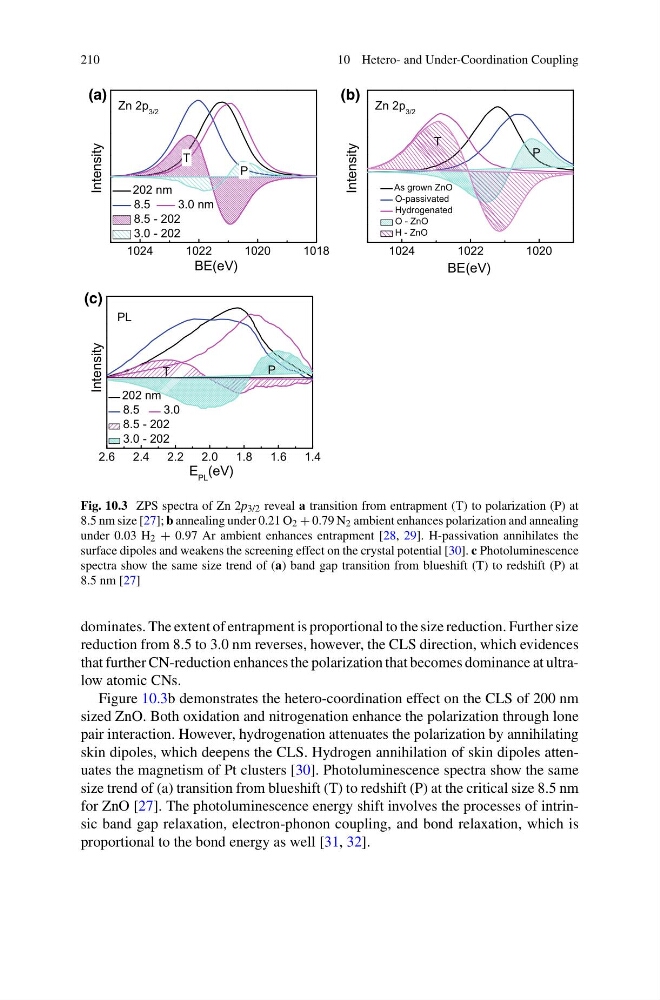
Fig. 10.3 ZPS spectra of Zn 2p 3/2 reveal a transition from entrapment (T) to polarization (P) at
8.5 nm size [27]; b annealing under 0.21 O 2 + 0.79 N 2 ambient enhances polarization and annealing
under 0.03 H 2 + 0.97 Ar ambient enhances entrapment [28, 29]. H-passivation annihilates the
surface dipoles and weakens the screening effect on the crystal potential [30]. c Photoluminescence
spectra show the same size trend of (a) band gap transition from blueshift (T) to redshift (P) at
8.5 nm [27]
dominates. The extent of entrapment is proportional to the size reduction. Further size
reduction from 8.5 to 3.0 nm reverses, however, the CLS direction, which evidences
that further CN-reduction enhances the polarization that becomes dominance at ultralow atomic CNs.
Figure 10.3b demonstrates the hetero-coordination effect on the CLS of 200 nm
sized ZnO. Both oxidation and nitrogenation enhance the polarization through lone
pair interaction. However, hydrogenation attenuates the polarization by annihilating
skin dipoles, which deepens the CLS. Hydrogen annihilation of skin dipoles attenuates the magnetism of Pt clusters [30]. Photoluminescence spectra show the same
size trend of (a) transition from blueshift (T) to redshift (P) at the critical size 8.5 nm
for ZnO [27]. The photoluminescence energy shift involves the processes of intrinsic band gap relaxation, electron-phonon coupling, and bond relaxation, which is
proportional to the bond energy as well [31, 32].
10 Hetero- and Under-Coordination Coupling
1024
1022
1020
1018
Zn 2p 3/2
202 nm
8.5
3.0 nm
8.5 - 202
3.0 - 202
Intensity
BE(eV)
T
P
1024
1022
1020
Zn 2p 3/2
As grown ZnO
O-passivated
Hydrogenated
O - ZnO
H - ZnO
Intensity
BE(eV)
P
T
2.6
2.4
2.2
2.0
1.8
1.6
1.4
202 nm
8.5
3.0
8.5 - 202
3.0 - 202
Intensity
E PL (eV)
P
T
PL
(a)
(b)
(c)
Fig. 10.3 ZPS spectra of Zn 2p 3/2 reveal a transition from entrapment (T) to polarization (P) at
8.5 nm size [27]; b annealing under 0.21 O 2 + 0.79 N 2 ambient enhances polarization and annealing
under 0.03 H 2 + 0.97 Ar ambient enhances entrapment [28, 29]. H-passivation annihilates the
surface dipoles and weakens the screening effect on the crystal potential [30]. c Photoluminescence
spectra show the same size trend of (a) band gap transition from blueshift (T) to redshift (P) at
8.5 nm [27]
dominates. The extent of entrapment is proportional to the size reduction. Further size
reduction from 8.5 to 3.0 nm reverses, however, the CLS direction, which evidences
that further CN-reduction enhances the polarization that becomes dominance at ultralow atomic CNs.
Figure 10.3b demonstrates the hetero-coordination effect on the CLS of 200 nm
sized ZnO. Both oxidation and nitrogenation enhance the polarization through lone
pair interaction. However, hydrogenation attenuates the polarization by annihilating
skin dipoles, which deepens the CLS. Hydrogen annihilation of skin dipoles attenuates the magnetism of Pt clusters [30]. Photoluminescence spectra show the same
size trend of (a) transition from blueshift (T) to redshift (P) at the critical size 8.5 nm
for ZnO [27]. The photoluminescence energy shift involves the processes of intrinsic band gap relaxation, electron-phonon coupling, and bond relaxation, which is
proportional to the bond energy as well [31, 32].