

168
8 Hetero-Coordinated Interfaces
365 366 367 368 369 370 371
300 K
573 K
573 K-300 K
AgPd
Ag 3d 5/2
(a)
Intensity
BE (eV)
B
I
332 333 334 335 336 337 338
AgPd:
Pd 3d 5/2
Intensity
BE (eV)
300 K
573 K
573 K-300 K
(b)
B
I
930 931 932 933 934 935
Intensity
BE(eV)
Cu-Pd
Cu 2p 3/2
540 K
940 K
940-540 K
(c)
B
I
334 335 336 337 338 339
CuPd
Pd 3d 5/2
Intensity
BE(eV)
540 K
940 K
940 K-540 K
(d)
B
I
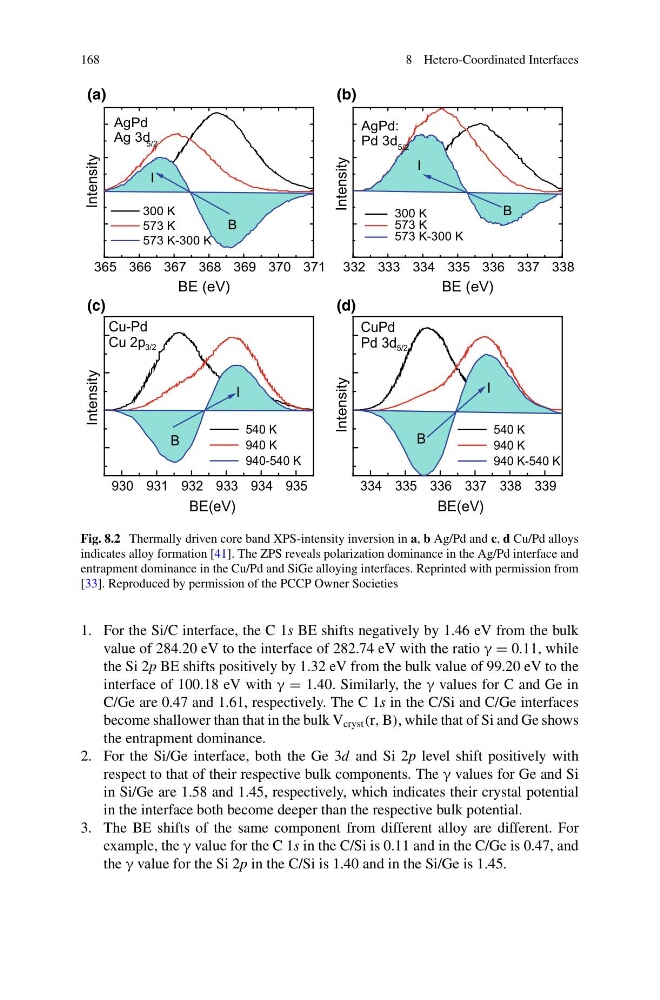
Fig. 8.2 Thermally driven core band XPS-intensity inversion in a, b Ag/Pd and c, d Cu/Pd alloys
indicates alloy formation [41]. The ZPS reveals polarization dominance in the Ag/Pd interface and
entrapment dominance in the Cu/Pd and SiGe alloying interfaces. Reprinted with permission from
[33]. Reproduced by permission of the PCCP Owner Societies
1. For the Si/C interface, the C 1s BE shifts negatively by 1.46 eV from the bulk
value of 284.20 eV to the interface of 282.74 eV with the ratio γ = 0.11, while
the Si 2p BE shifts positively by 1.32 eV from the bulk value of 99.20 eV to the
interface of 100.18 eV with γ = 1.40. Similarly, the γ values for C and Ge in
C/Ge are 0.47 and 1.61, respectively. The C 1s in the C/Si and C/Ge interfaces
become shallower than that in the bulk V cryst (r, B), while that of Si and Ge shows
the entrapment dominance.
2. For the Si/Ge interface, both the Ge 3d and Si 2p level shift positively with
respect to that of their respective bulk components. The γ values for Ge and Si
in Si/Ge are 1.58 and 1.45, respectively, which indicates their crystal potential
in the interface both become deeper than the respective bulk potential.
3. The BE shifts of the same component from different alloy are different. For
example, the γ value for the C 1s in the C/Si is 0.11 and in the C/Ge is 0.47, and
the γ value for the Si 2p in the C/Si is 1.40 and in the Si/Ge is 1.45.
8 Hetero-Coordinated Interfaces
365 366 367 368 369 370 371
300 K
573 K
573 K-300 K
AgPd
Ag 3d 5/2
(a)
Intensity
BE (eV)
B
I
332 333 334 335 336 337 338
AgPd:
Pd 3d 5/2
Intensity
BE (eV)
300 K
573 K
573 K-300 K
(b)
B
I
930 931 932 933 934 935
Intensity
BE(eV)
Cu-Pd
Cu 2p 3/2
540 K
940 K
940-540 K
(c)
B
I
334 335 336 337 338 339
CuPd
Pd 3d 5/2
Intensity
BE(eV)
540 K
940 K
940 K-540 K
(d)
B
I
Fig. 8.2 Thermally driven core band XPS-intensity inversion in a, b Ag/Pd and c, d Cu/Pd alloys
indicates alloy formation [41]. The ZPS reveals polarization dominance in the Ag/Pd interface and
entrapment dominance in the Cu/Pd and SiGe alloying interfaces. Reprinted with permission from
[33]. Reproduced by permission of the PCCP Owner Societies
1. For the Si/C interface, the C 1s BE shifts negatively by 1.46 eV from the bulk
value of 284.20 eV to the interface of 282.74 eV with the ratio γ = 0.11, while
the Si 2p BE shifts positively by 1.32 eV from the bulk value of 99.20 eV to the
interface of 100.18 eV with γ = 1.40. Similarly, the γ values for C and Ge in
C/Ge are 0.47 and 1.61, respectively. The C 1s in the C/Si and C/Ge interfaces
become shallower than that in the bulk V cryst (r, B), while that of Si and Ge shows
the entrapment dominance.
2. For the Si/Ge interface, both the Ge 3d and Si 2p level shift positively with
respect to that of their respective bulk components. The γ values for Ge and Si
in Si/Ge are 1.58 and 1.45, respectively, which indicates their crystal potential
in the interface both become deeper than the respective bulk potential.
3. The BE shifts of the same component from different alloy are different. For
example, the γ value for the C 1s in the C/Si is 0.11 and in the C/Ge is 0.47, and
the γ value for the Si 2p in the C/Si is 1.40 and in the Si/Ge is 1.45.