

7.4 ZPS: Monolayer Skin Entrapment and Defect Polarization
155
2 8 3
2 8 4
2 8 5
2 8 6
ΔI (a.u.)
E 1s (eV)
P D 5.335
4
3
2
T S T D
G
2.4 2.2
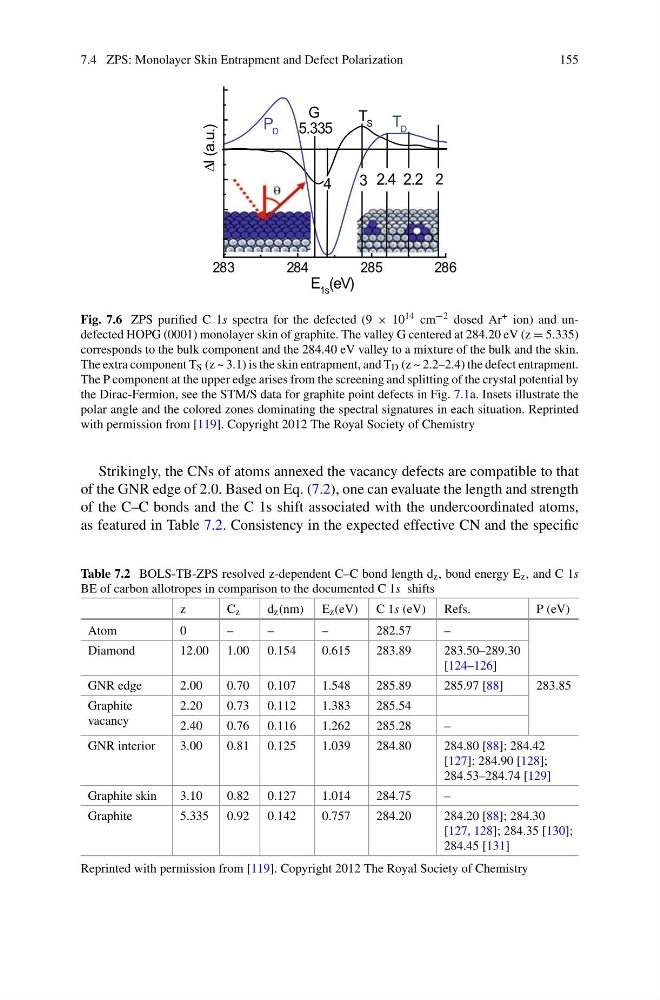
Fig. 7.6 ZPS purified C 1s spectra for the defected (9 × 10 14 cm −2 dosed Ar + ion) and undefected HOPG (0001) monolayer skin of graphite. The valley G centered at 284.20 eV (z = 5.335)
corresponds to the bulk component and the 284.40 eV valley to a mixture of the bulk and the skin.
The extra component T S (z ~ 3.1) is the skin entrapment, and T D (z ~ 2.2–2.4) the defect entrapment.
The P component at the upper edge arises from the screening and splitting of the crystal potential by
the Dirac-Fermion, see the STM/S data for graphite point defects in Fig. 7.1a. Insets illustrate the
polar angle and the colored zones dominating the spectral signatures in each situation. Reprinted
with permission from [119]. Copyright 2012 The Royal Society of Chemistry
Strikingly, the CNs of atoms annexed the vacancy defects are compatible to that
of the GNR edge of 2.0. Based on Eq. (7.2), one can evaluate the length and strength
of the C–C bonds and the C 1s shift associated with the undercoordinated atoms,
as featured in Table 7.2. Consistency in the expected effective CN and the specific
Table 7.2 BOLS-TB-ZPS resolved z-dependent C–C bond length d z , bond energy E z , and C 1s
BE of carbon allotropes in comparison to the documented C 1s shifts
z
C z
d z (nm) E z (eV) C 1s (eV) Refs.
P (eV)
Atom
0
–
–
–
282.57
–
Diamond
12.00 1.00 0.154
0.615
283.89
283.50–289.30
[124–126]
GNR edge
2.00
0.70 0.107
1.548
285.89
285.97 [88]
283.85
Graphite
vacancy
2.20
0.73 0.112
1.383
285.54
2.40
0.76 0.116
1.262
285.28
–
GNR interior
3.00
0.81 0.125
1.039
284.80
284.80 [88]; 284.42
[127]; 284.90 [128];
284.53–284.74 [129]
Graphite skin
3.10
0.82 0.127
1.014
284.75
–
Graphite
5.335 0.92 0.142
0.757
284.20
284.20 [88]; 284.30
[127, 128]; 284.35 [130];
284.45 [131]
Reprinted with permission from [119]. Copyright 2012 The Royal Society of Chemistry
155
2 8 3
2 8 4
2 8 5
2 8 6
ΔI (a.u.)
E 1s (eV)
P D 5.335
4
3
2
T S T D
G
2.4 2.2
Fig. 7.6 ZPS purified C 1s spectra for the defected (9 × 10 14 cm −2 dosed Ar + ion) and undefected HOPG (0001) monolayer skin of graphite. The valley G centered at 284.20 eV (z = 5.335)
corresponds to the bulk component and the 284.40 eV valley to a mixture of the bulk and the skin.
The extra component T S (z ~ 3.1) is the skin entrapment, and T D (z ~ 2.2–2.4) the defect entrapment.
The P component at the upper edge arises from the screening and splitting of the crystal potential by
the Dirac-Fermion, see the STM/S data for graphite point defects in Fig. 7.1a. Insets illustrate the
polar angle and the colored zones dominating the spectral signatures in each situation. Reprinted
with permission from [119]. Copyright 2012 The Royal Society of Chemistry
Strikingly, the CNs of atoms annexed the vacancy defects are compatible to that
of the GNR edge of 2.0. Based on Eq. (7.2), one can evaluate the length and strength
of the C–C bonds and the C 1s shift associated with the undercoordinated atoms,
as featured in Table 7.2. Consistency in the expected effective CN and the specific
Table 7.2 BOLS-TB-ZPS resolved z-dependent C–C bond length d z , bond energy E z , and C 1s
BE of carbon allotropes in comparison to the documented C 1s shifts
z
C z
d z (nm) E z (eV) C 1s (eV) Refs.
P (eV)
Atom
0
–
–
–
282.57
–
Diamond
12.00 1.00 0.154
0.615
283.89
283.50–289.30
[124–126]
GNR edge
2.00
0.70 0.107
1.548
285.89
285.97 [88]
283.85
Graphite
vacancy
2.20
0.73 0.112
1.383
285.54
2.40
0.76 0.116
1.262
285.28
–
GNR interior
3.00
0.81 0.125
1.039
284.80
284.80 [88]; 284.42
[127]; 284.90 [128];
284.53–284.74 [129]
Graphite skin
3.10
0.82 0.127
1.014
284.75
–
Graphite
5.335 0.92 0.142
0.757
284.20
284.20 [88]; 284.30
[127, 128]; 284.35 [130];
284.45 [131]
Reprinted with permission from [119]. Copyright 2012 The Royal Society of Chemistry