

6.9 Co, Fe, Pt, Rh, and Pd Nanocrystals
131
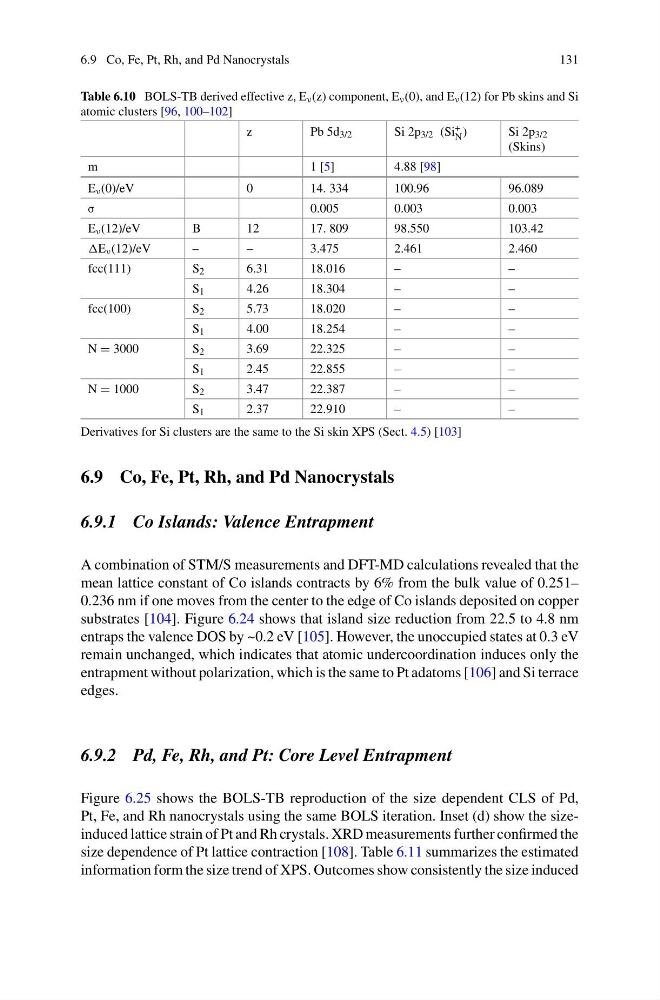
Table 6.10 BOLS-TB derived effective z, E ν (z) component, E ν (0), and E ν (12) for Pb skins and Si
atomic clusters [96, 100–102]
z
Pb 5d 3/2
Si 2p 3/2 (Si +
N )
Si 2p 3/2
(Skins)
m
1 [5]
4.88 [98]
E ν (0)/eV
0
14. 334
100.96
96.089
σ
0.005
0.003
0.003
E ν (12)/eV
B
12
17. 809
98.550
103.42
E ν (12)/eV
–
–
3.475
2.461
2.460
fcc(111)
S 2
6.31
18.016
–
–
S 1
4.26
18.304
–
–
fcc(100)
S 2
5.73
18.020
–
–
S 1
4.00
18.254
–
–
N = 3000
S 2
3.69
22.325
–
–
S 1
2.45
22.855
–
–
N = 1000
S 2
3.47
22.387
–
–
S 1
2.37
22.910
–
–
Derivatives for Si clusters are the same to the Si skin XPS (Sect. 4.5) [103]
6.9 Co, Fe, Pt, Rh, and Pd Nanocrystals
6.9.1 Co Islands: Valence Entrapment
A combination of STM/S measurements and DFT-MD calculations revealed that the
mean lattice constant of Co islands contracts by 6% from the bulk value of 0.251–
0.236 nm if one moves from the center to the edge of Co islands deposited on copper
substrates [104]. Figure 6.24 shows that island size reduction from 22.5 to 4.8 nm
entraps the valence DOS by ~0.2 eV [105]. However, the unoccupied states at 0.3 eV
remain unchanged, which indicates that atomic undercoordination induces only the
entrapment without polarization, which is the same to Pt adatoms [106] and Si terrace
edges.
6.9.2 Pd, Fe, Rh, and Pt: Core Level Entrapment
Figure 6.25 shows the BOLS-TB reproduction of the size dependent CLS of Pd,
Pt, Fe, and Rh nanocrystals using the same BOLS iteration. Inset (d) show the sizeinduced lattice strain of Pt and Rh crystals. XRD measurements further confirmed the
size dependence of Pt lattice contraction [108]. Table 6.11 summarizes the estimated
information form the size trend of XPS. Outcomes show consistently the size induced
131
Table 6.10 BOLS-TB derived effective z, E ν (z) component, E ν (0), and E ν (12) for Pb skins and Si
atomic clusters [96, 100–102]
z
Pb 5d 3/2
Si 2p 3/2 (Si +
N )
Si 2p 3/2
(Skins)
m
1 [5]
4.88 [98]
E ν (0)/eV
0
14. 334
100.96
96.089
σ
0.005
0.003
0.003
E ν (12)/eV
B
12
17. 809
98.550
103.42
E ν (12)/eV
–
–
3.475
2.461
2.460
fcc(111)
S 2
6.31
18.016
–
–
S 1
4.26
18.304
–
–
fcc(100)
S 2
5.73
18.020
–
–
S 1
4.00
18.254
–
–
N = 3000
S 2
3.69
22.325
–
–
S 1
2.45
22.855
–
–
N = 1000
S 2
3.47
22.387
–
–
S 1
2.37
22.910
–
–
Derivatives for Si clusters are the same to the Si skin XPS (Sect. 4.5) [103]
6.9 Co, Fe, Pt, Rh, and Pd Nanocrystals
6.9.1 Co Islands: Valence Entrapment
A combination of STM/S measurements and DFT-MD calculations revealed that the
mean lattice constant of Co islands contracts by 6% from the bulk value of 0.251–
0.236 nm if one moves from the center to the edge of Co islands deposited on copper
substrates [104]. Figure 6.24 shows that island size reduction from 22.5 to 4.8 nm
entraps the valence DOS by ~0.2 eV [105]. However, the unoccupied states at 0.3 eV
remain unchanged, which indicates that atomic undercoordination induces only the
entrapment without polarization, which is the same to Pt adatoms [106] and Si terrace
edges.
6.9.2 Pd, Fe, Rh, and Pt: Core Level Entrapment
Figure 6.25 shows the BOLS-TB reproduction of the size dependent CLS of Pd,
Pt, Fe, and Rh nanocrystals using the same BOLS iteration. Inset (d) show the sizeinduced lattice strain of Pt and Rh crystals. XRD measurements further confirmed the
size dependence of Pt lattice contraction [108]. Table 6.11 summarizes the estimated
information form the size trend of XPS. Outcomes show consistently the size induced