

6.7 Li, Na, K, Rb, and Cs Clusters and Skins
123
-25.8
-25.6
-25.4
-25.2
-25.0
LDOS
E-E F (eV)
atom 1
atom 2
Na 13
(a)
-25.8
-25.5
-25.2
-24.9
-24.6
LDOS
E-E F (eV)
atom 1
atom 2
atom 3
Na 55
(b)
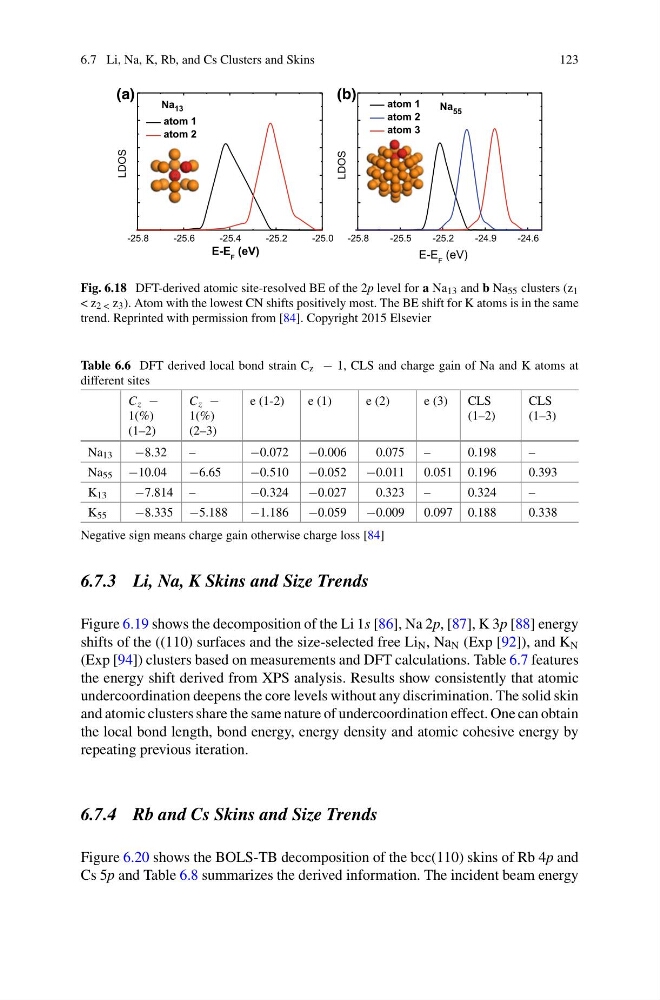
Fig. 6.18 DFT-derived atomic site-resolved BE of the 2p level for a Na 13 and b Na 55 clusters (z 1
< z 2 < z 3 ). Atom with the lowest CN shifts positively most. The BE shift for K atoms is in the same
trend. Reprinted with permission from [84]. Copyright 2015 Elsevier
Table 6.6 DFT derived local bond strain C z − 1, CLS and charge gain of Na and K atoms at
different sites
C z −
1(%)
(1–2)
C z −
1(%)
(2–3)
e (1-2)
e (1)
e (2)
e (3)
CLS
(1–2)
CLS
(1–3)
Na 13
−8.32
–
−0.072
−0.006
0.075
–
0.198
–
Na 55 −10.04
−6.65
−0.510
−0.052
−0.011
0.051 0.196
0.393
K 13
−7.814 –
−0.324
−0.027
0.323
–
0.324
–
K 55
−8.335 −5.188
−1.186
−0.059
−0.009
0.097 0.188
0.338
Negative sign means charge gain otherwise charge loss [84]
6.7.3 Li, Na, K Skins and Size Trends
Figure 6.19 shows the decomposition of the Li 1s [86], Na 2p, [87], K 3p [88] energy
shifts of the ((110) surfaces and the size-selected free Li N , Na N (Exp [92]), and K N
(Exp [94]) clusters based on measurements and DFT calculations. Table 6.7 features
the energy shift derived from XPS analysis. Results show consistently that atomic
undercoordination deepens the core levels without any discrimination. The solid skin
and atomic clusters share the same nature of undercoordination effect. One can obtain
the local bond length, bond energy, energy density and atomic cohesive energy by
repeating previous iteration.
6.7.4 Rb and Cs Skins and Size Trends
Figure 6.20 shows the BOLS-TB decomposition of the bcc(110) skins of Rb 4p and
Cs 5p and Table 6.8 summarizes the derived information. The incident beam energy
123
-25.8
-25.6
-25.4
-25.2
-25.0
LDOS
E-E F (eV)
atom 1
atom 2
Na 13
(a)
-25.8
-25.5
-25.2
-24.9
-24.6
LDOS
E-E F (eV)
atom 1
atom 2
atom 3
Na 55
(b)
Fig. 6.18 DFT-derived atomic site-resolved BE of the 2p level for a Na 13 and b Na 55 clusters (z 1
< z 2 < z 3 ). Atom with the lowest CN shifts positively most. The BE shift for K atoms is in the same
trend. Reprinted with permission from [84]. Copyright 2015 Elsevier
Table 6.6 DFT derived local bond strain C z − 1, CLS and charge gain of Na and K atoms at
different sites
C z −
1(%)
(1–2)
C z −
1(%)
(2–3)
e (1-2)
e (1)
e (2)
e (3)
CLS
(1–2)
CLS
(1–3)
Na 13
−8.32
–
−0.072
−0.006
0.075
–
0.198
–
Na 55 −10.04
−6.65
−0.510
−0.052
−0.011
0.051 0.196
0.393
K 13
−7.814 –
−0.324
−0.027
0.323
–
0.324
–
K 55
−8.335 −5.188
−1.186
−0.059
−0.009
0.097 0.188
0.338
Negative sign means charge gain otherwise charge loss [84]
6.7.3 Li, Na, K Skins and Size Trends
Figure 6.19 shows the decomposition of the Li 1s [86], Na 2p, [87], K 3p [88] energy
shifts of the ((110) surfaces and the size-selected free Li N , Na N (Exp [92]), and K N
(Exp [94]) clusters based on measurements and DFT calculations. Table 6.7 features
the energy shift derived from XPS analysis. Results show consistently that atomic
undercoordination deepens the core levels without any discrimination. The solid skin
and atomic clusters share the same nature of undercoordination effect. One can obtain
the local bond length, bond energy, energy density and atomic cohesive energy by
repeating previous iteration.
6.7.4 Rb and Cs Skins and Size Trends
Figure 6.20 shows the BOLS-TB decomposition of the bcc(110) skins of Rb 4p and
Cs 5p and Table 6.8 summarizes the derived information. The incident beam energy