

6.4 Silver
109
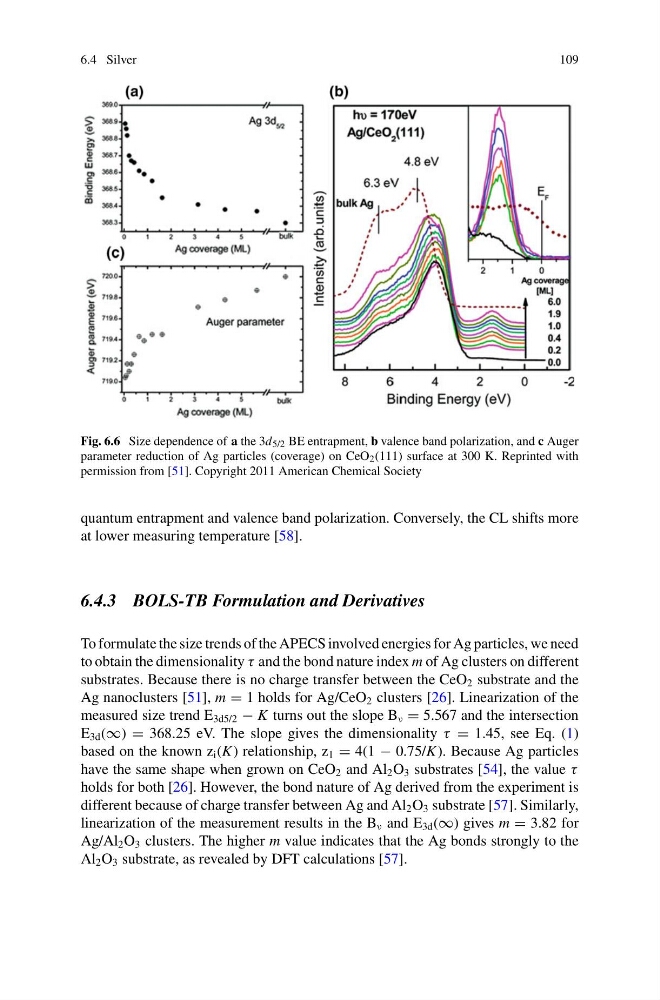
Fig. 6.6 Size dependence of a the 3d 5/2 BE entrapment, b valence band polarization, and c Auger
parameter reduction of Ag particles (coverage) on CeO 2 (111) surface at 300 K. Reprinted with
permission from [51]. Copyright 2011 American Chemical Society
quantum entrapment and valence band polarization. Conversely, the CL shifts more
at lower measuring temperature [58].
6.4.3 BOLS-TB Formulation and Derivatives
To formulate the size trends of the APECS involved energies for Ag particles, we need
to obtain the dimensionality τ and the bond nature index m of Ag clusters on different
substrates. Because there is no charge transfer between the CeO 2 substrate and the
Ag nanoclusters [51], m = 1 holds for Ag/CeO 2 clusters [26]. Linearization of the
measured size trend E 3d5/2 − K turns out the slope B ν = 5.567 and the intersection
E 3d (∞) = 368.25 eV. The slope gives the dimensionality τ = 1.45, see Eq. (1)
based on the known z i (K) relationship, z 1 = 4(1 − 0.75/K). Because Ag particles
have the same shape when grown on CeO 2 and Al 2 O 3 substrates [54], the value τ
holds for both [26]. However, the bond nature of Ag derived from the experiment is
different because of charge transfer between Ag and Al 2 O 3 substrate [57]. Similarly,
linearization of the measurement results in the B ν and E 3d (∞) gives m = 3.82 for
Ag/Al 2 O 3 clusters. The higher m value indicates that the Ag bonds strongly to the
Al 2 O 3 substrate, as revealed by DFT calculations [57].
109
Fig. 6.6 Size dependence of a the 3d 5/2 BE entrapment, b valence band polarization, and c Auger
parameter reduction of Ag particles (coverage) on CeO 2 (111) surface at 300 K. Reprinted with
permission from [51]. Copyright 2011 American Chemical Society
quantum entrapment and valence band polarization. Conversely, the CL shifts more
at lower measuring temperature [58].
6.4.3 BOLS-TB Formulation and Derivatives
To formulate the size trends of the APECS involved energies for Ag particles, we need
to obtain the dimensionality τ and the bond nature index m of Ag clusters on different
substrates. Because there is no charge transfer between the CeO 2 substrate and the
Ag nanoclusters [51], m = 1 holds for Ag/CeO 2 clusters [26]. Linearization of the
measured size trend E 3d5/2 − K turns out the slope B ν = 5.567 and the intersection
E 3d (∞) = 368.25 eV. The slope gives the dimensionality τ = 1.45, see Eq. (1)
based on the known z i (K) relationship, z 1 = 4(1 − 0.75/K). Because Ag particles
have the same shape when grown on CeO 2 and Al 2 O 3 substrates [54], the value τ
holds for both [26]. However, the bond nature of Ag derived from the experiment is
different because of charge transfer between Ag and Al 2 O 3 substrate [57]. Similarly,
linearization of the measurement results in the B ν and E 3d (∞) gives m = 3.82 for
Ag/Al 2 O 3 clusters. The higher m value indicates that the Ag bonds strongly to the
Al 2 O 3 substrate, as revealed by DFT calculations [57].