

necessarily be close to the nucleation pressure. An extreme example of this is
methanol where the solid was nucleated at 7 GPa but the crystal was finally grown
at 4 GPa due to the inability to melt the sample at 7 GPa [15]. The melting line of the
sample can be determined solely from observing the reduction in the crystallite size
during isothermal pressure annealing, but other methods have used volumetric
measurements to ascertain it. Work by Bridgman [18] and more recently Dziubek
and Katrusiak [19, 20] have shown that not only can the melting line be observed but
new high-pressure phases can be observed if there is a discontinuity in the pressurevolume plot; in fact, these measurements provided the basis for our study and
discovery of a new polymorph of 2-methylphenol at 0.65 GPa [18, 21].
Once the melting point has been determined, this can be used to anneal the
polycrystalline material into a single crystal through pressure cycling. The isolation
of novel phases through isothermal pressure cycling will be limited due to the
reliance on the phases being stable at a particular pressure at ambient temperature.
To access novel forms of a low-melting compound, there may be a requirement to
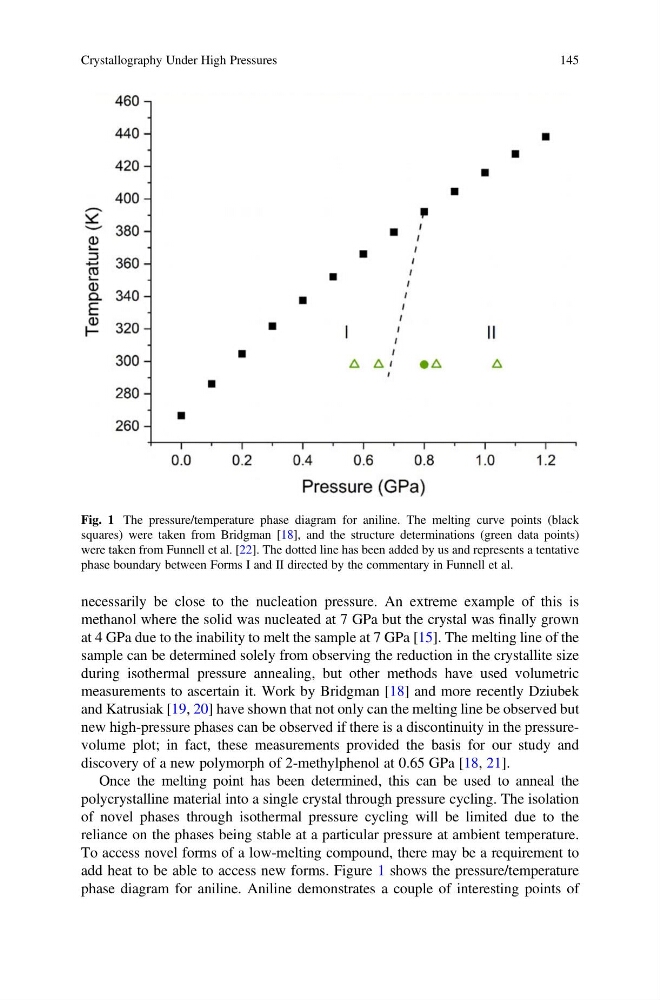
add heat to be able to access new forms. Figure 1 shows the pressure/temperature
phase diagram for aniline. Aniline demonstrates a couple of interesting points of
Fig. 1 The pressure/temperature phase diagram for aniline. The melting curve points (black
squares) were taken from Bridgman [18], and the structure determinations (green data points)
were taken from Funnell et al. [22]. The dotted line has been added by us and represents a tentative
phase boundary between Forms I and II directed by the commentary in Funnell et al.
Crystallography Under High Pressures
145
methanol where the solid was nucleated at 7 GPa but the crystal was finally grown
at 4 GPa due to the inability to melt the sample at 7 GPa [15]. The melting line of the
sample can be determined solely from observing the reduction in the crystallite size
during isothermal pressure annealing, but other methods have used volumetric
measurements to ascertain it. Work by Bridgman [18] and more recently Dziubek
and Katrusiak [19, 20] have shown that not only can the melting line be observed but
new high-pressure phases can be observed if there is a discontinuity in the pressurevolume plot; in fact, these measurements provided the basis for our study and
discovery of a new polymorph of 2-methylphenol at 0.65 GPa [18, 21].
Once the melting point has been determined, this can be used to anneal the
polycrystalline material into a single crystal through pressure cycling. The isolation
of novel phases through isothermal pressure cycling will be limited due to the
reliance on the phases being stable at a particular pressure at ambient temperature.
To access novel forms of a low-melting compound, there may be a requirement to
add heat to be able to access new forms. Figure 1 shows the pressure/temperature
phase diagram for aniline. Aniline demonstrates a couple of interesting points of
Fig. 1 The pressure/temperature phase diagram for aniline. The melting curve points (black
squares) were taken from Bridgman [18], and the structure determinations (green data points)
were taken from Funnell et al. [22]. The dotted line has been added by us and represents a tentative
phase boundary between Forms I and II directed by the commentary in Funnell et al.
Crystallography Under High Pressures
145