

since the CSD began – over 90% of structures in the CSD now have hydrogen atom
coordinates included.
3.2 The Evolution of the Structural Database
It took 5 years to collate the first volumes of the CSD which were published as a
book series, Molecular Structures and Dimensions, in 1970. It was soon realised that
to make the most of the database, it would be useful to be able to search and retrieve
collected structural data electronically, and a computer system was developed
[101]. This section highlights the current state of the art, alongside some key
developments in the intervening years, in key areas where an electronic database
system adds value to the collection of data.
3.2.1 Visualisation and Analysis
Crystallography is a powerful technique, providing accurate and unambiguous
information about the 3D nature of molecules and solid-state crystal structures.
For this reason, visualisation of structures is very important. A large number of
visualisation software packages have been made available over the years; some
examples include ORTEP [102], Diamond [103], CrystalMaker [104], XP [105],
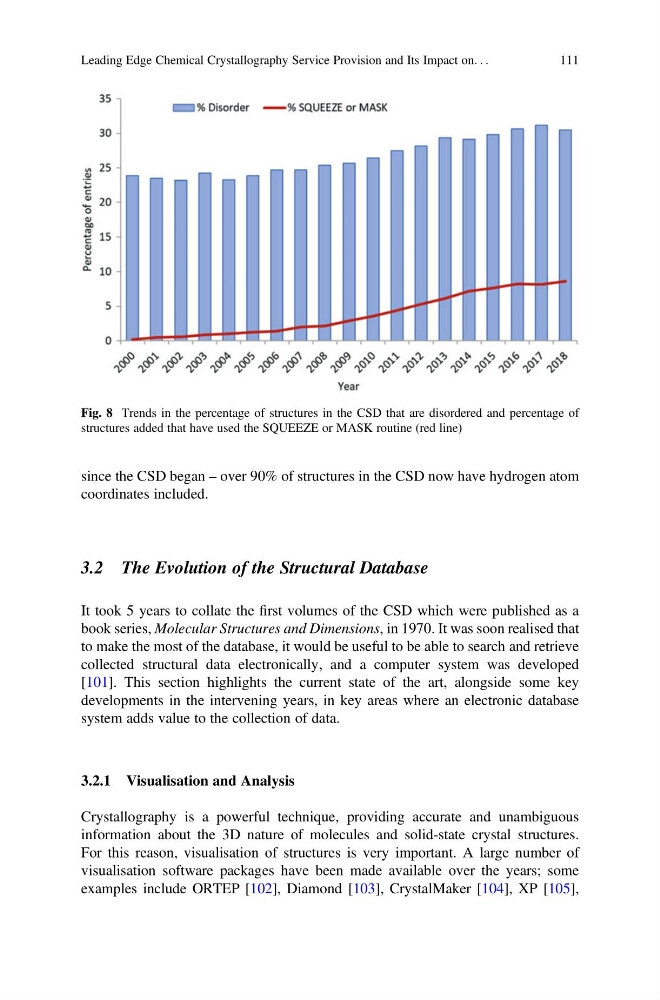
Fig. 8 Trends in the percentage of structures in the CSD that are disordered and percentage of
structures added that have used the SQUEEZE or MASK routine (red line)
Leading Edge Chemical Crystallography Service Provision and Its Impact on. . .
111
coordinates included.
3.2 The Evolution of the Structural Database
It took 5 years to collate the first volumes of the CSD which were published as a
book series, Molecular Structures and Dimensions, in 1970. It was soon realised that
to make the most of the database, it would be useful to be able to search and retrieve
collected structural data electronically, and a computer system was developed
[101]. This section highlights the current state of the art, alongside some key
developments in the intervening years, in key areas where an electronic database
system adds value to the collection of data.
3.2.1 Visualisation and Analysis
Crystallography is a powerful technique, providing accurate and unambiguous
information about the 3D nature of molecules and solid-state crystal structures.
For this reason, visualisation of structures is very important. A large number of
visualisation software packages have been made available over the years; some
examples include ORTEP [102], Diamond [103], CrystalMaker [104], XP [105],
Fig. 8 Trends in the percentage of structures in the CSD that are disordered and percentage of
structures added that have used the SQUEEZE or MASK routine (red line)
Leading Edge Chemical Crystallography Service Provision and Its Impact on. . .
111