

I th ¼ 4 Â 10
9 E
4
i eV
ð Þ
Z
2
W=cm
2
Â
Ã
ð2:1:23Þ
This is derived from the relation that the maximum barrier potential given by (2.1.2)
is equal to the ground state binding energy.
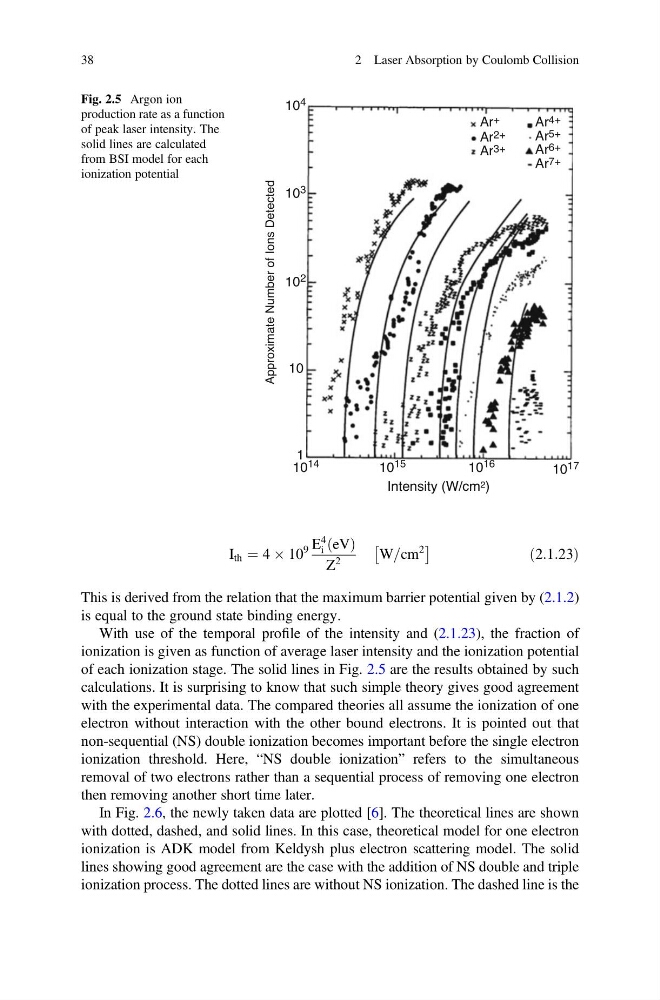
With use of the temporal profile of the intensity and (2.1.23), the fraction of
ionization is given as function of average laser intensity and the ionization potential
of each ionization stage. The solid lines in Fig. 2.5 are the results obtained by such
calculations. It is surprising to know that such simple theory gives good agreement
with the experimental data. The compared theories all assume the ionization of one
electron without interaction with the other bound electrons. It is pointed out that
non-sequential (NS) double ionization becomes important before the single electron
ionization threshold. Here, “NS double ionization” refers to the simultaneous
removal of two electrons rather than a sequential process of removing one electron
then removing another short time later.
In Fig. 2.6, the newly taken data are plotted [6]. The theoretical lines are shown
with dotted, dashed, and solid lines. In this case, theoretical model for one electron
ionization is ADK model from Keldysh plus electron scattering model. The solid
lines showing good agreement are the case with the addition of NS double and triple
ionization process. The dotted lines are without NS ionization. The dashed line is the
10 4
Ar +
Ar 2+
Ar 3+
Ar 4+
Ar 5+
Ar 6+
Ar 7+
10 3
10 2
10 14
10 15
10 16
Intensity (W/cm 2 )
10 17
10
Approximate Number of Ions Detected
1
Fig. 2.5 Argon ion
production rate as a function
of peak laser intensity. The
solid lines are calculated
from BSI model for each
ionization potential
38
2 Laser Absorption by Coulomb Collision
9 E
4
i eV
ð Þ
Z
2
W=cm
2
Â
Ã
ð2:1:23Þ
This is derived from the relation that the maximum barrier potential given by (2.1.2)
is equal to the ground state binding energy.
With use of the temporal profile of the intensity and (2.1.23), the fraction of
ionization is given as function of average laser intensity and the ionization potential
of each ionization stage. The solid lines in Fig. 2.5 are the results obtained by such
calculations. It is surprising to know that such simple theory gives good agreement
with the experimental data. The compared theories all assume the ionization of one
electron without interaction with the other bound electrons. It is pointed out that
non-sequential (NS) double ionization becomes important before the single electron
ionization threshold. Here, “NS double ionization” refers to the simultaneous
removal of two electrons rather than a sequential process of removing one electron
then removing another short time later.
In Fig. 2.6, the newly taken data are plotted [6]. The theoretical lines are shown
with dotted, dashed, and solid lines. In this case, theoretical model for one electron
ionization is ADK model from Keldysh plus electron scattering model. The solid
lines showing good agreement are the case with the addition of NS double and triple
ionization process. The dotted lines are without NS ionization. The dashed line is the
10 4
Ar +
Ar 2+
Ar 3+
Ar 4+
Ar 5+
Ar 6+
Ar 7+
10 3
10 2
10 14
10 15
10 16
Intensity (W/cm 2 )
10 17
10
Approximate Number of Ions Detected
1
Fig. 2.5 Argon ion
production rate as a function
of peak laser intensity. The
solid lines are calculated
from BSI model for each
ionization potential
38
2 Laser Absorption by Coulomb Collision