

is converted to the second, and higher harmonic signal and both of the fundamental
(800 nm) and second harmonics (400 nm) light reflected from the target haven been
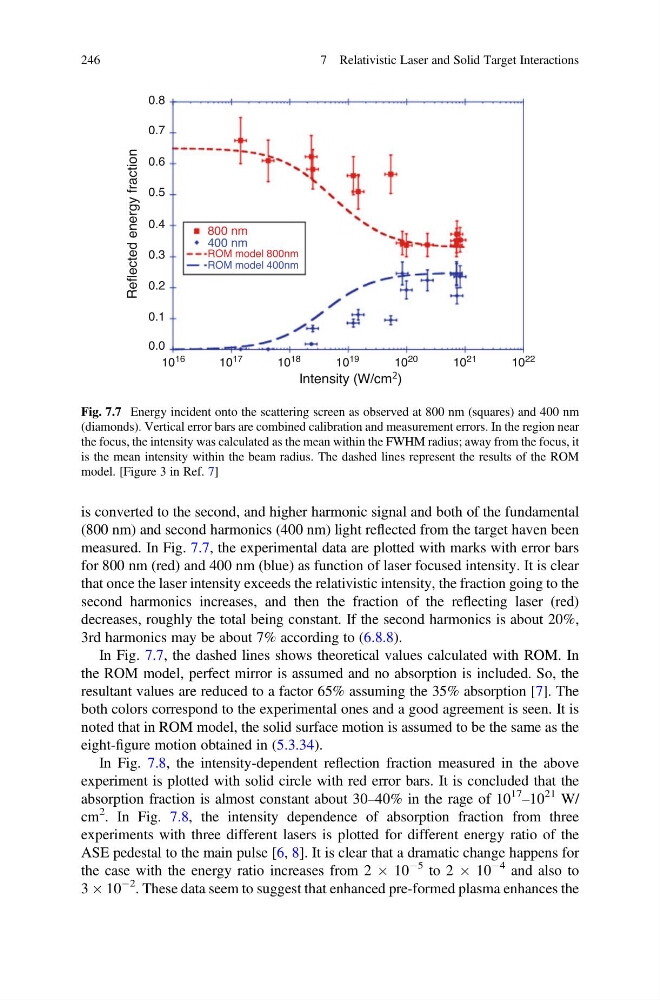
measured. In Fig. 7.7, the experimental data are plotted with marks with error bars
for 800 nm (red) and 400 nm (blue) as function of laser focused intensity. It is clear
that once the laser intensity exceeds the relativistic intensity, the fraction going to the
second harmonics increases, and then the fraction of the reflecting laser (red)
decreases, roughly the total being constant. If the second harmonics is about 20%,
3rd harmonics may be about 7% according to (6.8.8).
In Fig. 7.7, the dashed lines shows theoretical values calculated with ROM. In
the ROM model, perfect mirror is assumed and no absorption is included. So, the
resultant values are reduced to a factor 65% assuming the 35% absorption [7]. The
both colors correspond to the experimental ones and a good agreement is seen. It is
noted that in ROM model, the solid surface motion is assumed to be the same as the
eight-figure motion obtained in (5.3.34).
In Fig. 7.8, the intensity-dependent reflection fraction measured in the above
experiment is plotted with solid circle with red error bars. It is concluded that the
absorption fraction is almost constant about 30–40% in the rage of 10
17
–10
21 W/
cm
2 . In Fig. 7.8, the intensity dependence of absorption fraction from three
experiments with three different lasers is plotted for different energy ratio of the
ASE pedestal to the main pulse [6, 8]. It is clear that a dramatic change happens for
the case with the energy ratio increases from 2 Â 10
À5 to 2 Â 10
À4 and also to
3 Â 10
À2 . These data seem to suggest that enhanced pre-formed plasma enhances the
0.8
0.7
0.6
0.5
0.4
0.3
800 nm
400 nm
ROM model 800nm
ROM model 400nm
0.2
0.1
0.0
10
16
10
17
10
18
Reflected energy fraction
Intensity (W/cm 2 )
10
19
10
20
10
21
10
22
Fig. 7.7 Energy incident onto the scattering screen as observed at 800 nm (squares) and 400 nm
(diamonds). Vertical error bars are combined calibration and measurement errors. In the region near
the focus, the intensity was calculated as the mean within the FWHM radius; away from the focus, it
is the mean intensity within the beam radius. The dashed lines represent the results of the ROM
model. [Figure 3 in Ref. 7]
246
7 Relativistic Laser and Solid Target Interactions
(800 nm) and second harmonics (400 nm) light reflected from the target haven been
measured. In Fig. 7.7, the experimental data are plotted with marks with error bars
for 800 nm (red) and 400 nm (blue) as function of laser focused intensity. It is clear
that once the laser intensity exceeds the relativistic intensity, the fraction going to the
second harmonics increases, and then the fraction of the reflecting laser (red)
decreases, roughly the total being constant. If the second harmonics is about 20%,
3rd harmonics may be about 7% according to (6.8.8).
In Fig. 7.7, the dashed lines shows theoretical values calculated with ROM. In
the ROM model, perfect mirror is assumed and no absorption is included. So, the
resultant values are reduced to a factor 65% assuming the 35% absorption [7]. The
both colors correspond to the experimental ones and a good agreement is seen. It is
noted that in ROM model, the solid surface motion is assumed to be the same as the
eight-figure motion obtained in (5.3.34).
In Fig. 7.8, the intensity-dependent reflection fraction measured in the above
experiment is plotted with solid circle with red error bars. It is concluded that the
absorption fraction is almost constant about 30–40% in the rage of 10
17
–10
21 W/
cm
2 . In Fig. 7.8, the intensity dependence of absorption fraction from three
experiments with three different lasers is plotted for different energy ratio of the
ASE pedestal to the main pulse [6, 8]. It is clear that a dramatic change happens for
the case with the energy ratio increases from 2 Â 10
À5 to 2 Â 10
À4 and also to
3 Â 10
À2 . These data seem to suggest that enhanced pre-formed plasma enhances the
0.8
0.7
0.6
0.5
0.4
0.3
800 nm
400 nm
ROM model 800nm
ROM model 400nm
0.2
0.1
0.0
10
16
10
17
10
18
Reflected energy fraction
Intensity (W/cm 2 )
10
19
10
20
10
21
10
22
Fig. 7.7 Energy incident onto the scattering screen as observed at 800 nm (squares) and 400 nm
(diamonds). Vertical error bars are combined calibration and measurement errors. In the region near
the focus, the intensity was calculated as the mean within the FWHM radius; away from the focus, it
is the mean intensity within the beam radius. The dashed lines represent the results of the ROM
model. [Figure 3 in Ref. 7]
246
7 Relativistic Laser and Solid Target Interactions