

4.10 Processes in the Innermost Coma
4.10.1 Comparisons of Models of 67P with Data
Crifo et al. (2002b) made the first comparisons between models of the appearance of
the innermost dust coma with spacecraft observation by studying the brightness
distribution at 1P/Halley recorded by the imaging system on the Russian Vega
spacecraft. The detail shown by the observations was limited by the de-focussing
of the Vega 1 camera but this was the first attempt at a self-consistent model of an
observed dust outflow.
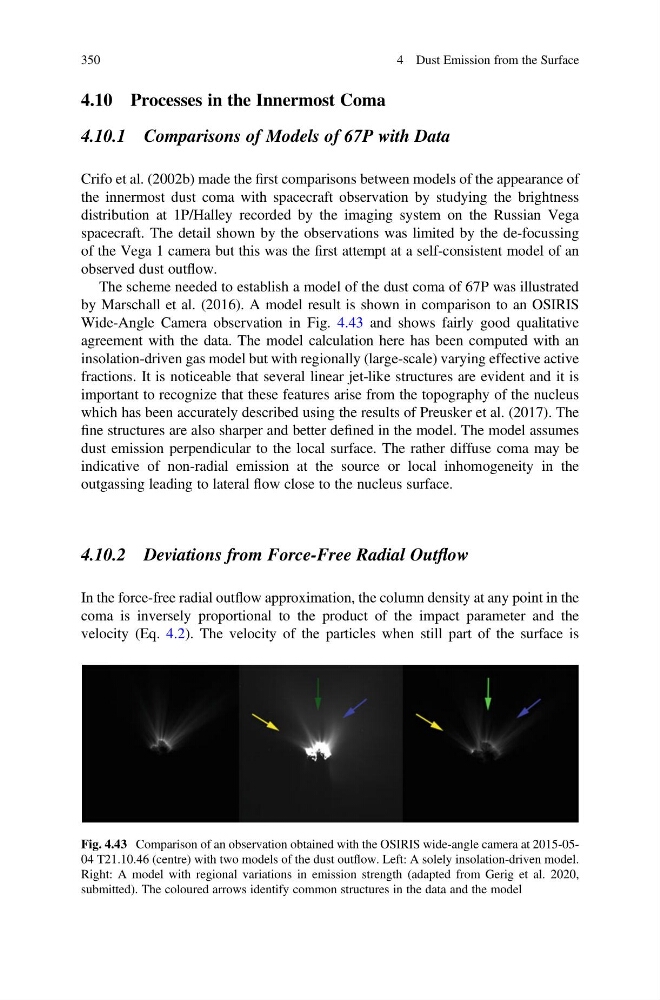
The scheme needed to establish a model of the dust coma of 67P was illustrated
by Marschall et al. (2016). A model result is shown in comparison to an OSIRIS
Wide-Angle Camera observation in Fig. 4.43 and shows fairly good qualitative
agreement with the data. The model calculation here has been computed with an
insolation-driven gas model but with regionally (large-scale) varying effective active
fractions. It is noticeable that several linear jet-like structures are evident and it is
important to recognize that these features arise from the topography of the nucleus
which has been accurately described using the results of Preusker et al. (2017). The
fine structures are also sharper and better defined in the model. The model assumes
dust emission perpendicular to the local surface. The rather diffuse coma may be
indicative of non-radial emission at the source or local inhomogeneity in the
outgassing leading to lateral flow close to the nucleus surface.
4.10.2 Deviations from Force-Free Radial Outflow
In the force-free radial outflow approximation, the column density at any point in the
coma is inversely proportional to the product of the impact parameter and the
velocity (Eq. 4.2). The velocity of the particles when still part of the surface is
Fig. 4.43 Comparison of an observation obtained with the OSIRIS wide-angle camera at 2015-0504 T21.10.46 (centre) with two models of the dust outflow. Left: A solely insolation-driven model.
Right: A model with regional variations in emission strength (adapted from Gerig et al. 2020,
submitted). The coloured arrows identify common structures in the data and the model
350
4 Dust Emission from the Surface
4.10.1 Comparisons of Models of 67P with Data
Crifo et al. (2002b) made the first comparisons between models of the appearance of
the innermost dust coma with spacecraft observation by studying the brightness
distribution at 1P/Halley recorded by the imaging system on the Russian Vega
spacecraft. The detail shown by the observations was limited by the de-focussing
of the Vega 1 camera but this was the first attempt at a self-consistent model of an
observed dust outflow.
The scheme needed to establish a model of the dust coma of 67P was illustrated
by Marschall et al. (2016). A model result is shown in comparison to an OSIRIS
Wide-Angle Camera observation in Fig. 4.43 and shows fairly good qualitative
agreement with the data. The model calculation here has been computed with an
insolation-driven gas model but with regionally (large-scale) varying effective active
fractions. It is noticeable that several linear jet-like structures are evident and it is
important to recognize that these features arise from the topography of the nucleus
which has been accurately described using the results of Preusker et al. (2017). The
fine structures are also sharper and better defined in the model. The model assumes
dust emission perpendicular to the local surface. The rather diffuse coma may be
indicative of non-radial emission at the source or local inhomogeneity in the
outgassing leading to lateral flow close to the nucleus surface.
4.10.2 Deviations from Force-Free Radial Outflow
In the force-free radial outflow approximation, the column density at any point in the
coma is inversely proportional to the product of the impact parameter and the
velocity (Eq. 4.2). The velocity of the particles when still part of the surface is
Fig. 4.43 Comparison of an observation obtained with the OSIRIS wide-angle camera at 2015-0504 T21.10.46 (centre) with two models of the dust outflow. Left: A solely insolation-driven model.
Right: A model with regional variations in emission strength (adapted from Gerig et al. 2020,
submitted). The coloured arrows identify common structures in the data and the model
350
4 Dust Emission from the Surface