

close to the source implying non-radial hydrodynamic expansion. Finally, the finer
structures are actually very weak producing a variation in the brightness of only
around 10% at 3 km from the nucleus which is completely lost by the time the flow
reaches 10 km from the nucleus. This loss of structure is presumably caused by
non-radial emission at source or by non-radial gas flow (the acceleration indicates
that the dust is still coupled to the gas).
Originally, the fine structures were not referred to as “jets”, in part, because the
mechanism by which they arise was (and remains) unclear. We consider four of the
possibilities here,
• local enhancements of the production rate,
• local changes in the dust size distribution,
• local minima in the production rate,
• topographic focussing.
Localised enhancements of the dust production rate can of course occur. This
would be a “jet”. However, there are subtle issues with this mechanism. If the dust to
gas production rate ratio remains constant, then the gas production rate must also
increase. The expansion of the gas into the lower density medium surrounding the jet
would dilute the observed enhancement in the dust and reduce its collimation. The
increase in brightness within the finer structure is only of the order of 10% with
respect to the surroundings but the structure is relatively narrow and we are looking
through a column of dust. Hence, the actual increase in production in the structure
relative to its immediate surroundings must be much higher. Although no published
test of the parameter space has been made, this suggests that there are limits to how
bright these structures can become with this mechanism. We shall see extreme
examples of this in the next sub-section.
A way around this is either to enhance the dust only or to modify the local dust
size distribution so that the scattering properties are changed. This implies that the
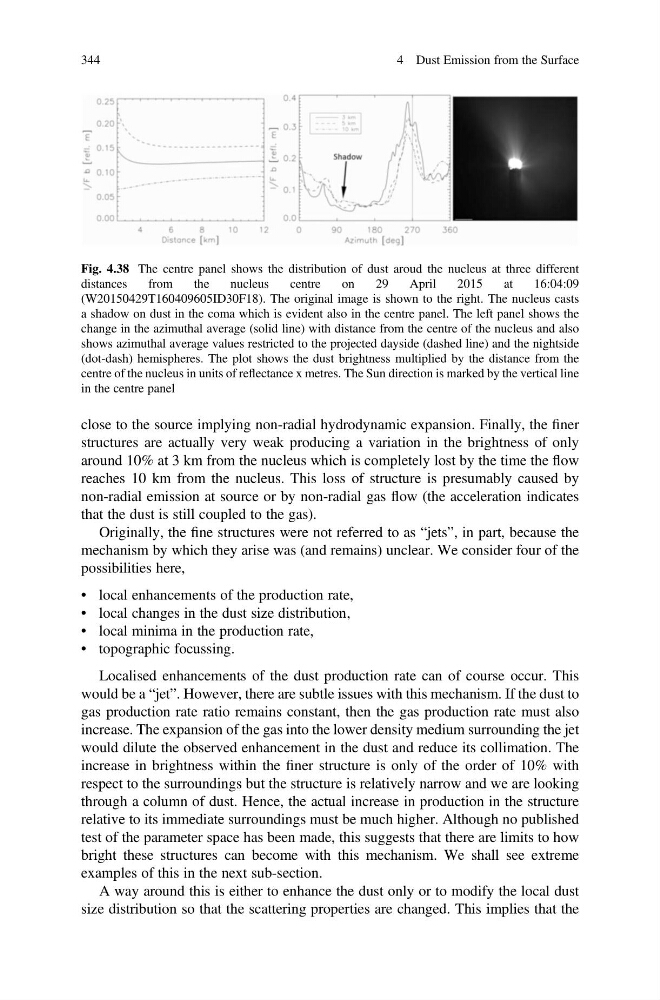
Fig. 4.38 The centre panel shows the distribution of dust aroud the nucleus at three different
distances
from
the
nucleus
centre
on
29
April
2015
at
16:04:09
(W20150429T160409605ID30F18). The original image is shown to the right. The nucleus casts
a shadow on dust in the coma which is evident also in the centre panel. The left panel shows the
change in the azimuthal average (solid line) with distance from the centre of the nucleus and also
shows azimuthal average values restricted to the projected dayside (dashed line) and the nightside
(dot-dash) hemispheres. The plot shows the dust brightness multiplied by the distance from the
centre of the nucleus in units of reflectance x metres. The Sun direction is marked by the vertical line
in the centre panel
344
4 Dust Emission from the Surface
structures are actually very weak producing a variation in the brightness of only
around 10% at 3 km from the nucleus which is completely lost by the time the flow
reaches 10 km from the nucleus. This loss of structure is presumably caused by
non-radial emission at source or by non-radial gas flow (the acceleration indicates
that the dust is still coupled to the gas).
Originally, the fine structures were not referred to as “jets”, in part, because the
mechanism by which they arise was (and remains) unclear. We consider four of the
possibilities here,
• local enhancements of the production rate,
• local changes in the dust size distribution,
• local minima in the production rate,
• topographic focussing.
Localised enhancements of the dust production rate can of course occur. This
would be a “jet”. However, there are subtle issues with this mechanism. If the dust to
gas production rate ratio remains constant, then the gas production rate must also
increase. The expansion of the gas into the lower density medium surrounding the jet
would dilute the observed enhancement in the dust and reduce its collimation. The
increase in brightness within the finer structure is only of the order of 10% with
respect to the surroundings but the structure is relatively narrow and we are looking
through a column of dust. Hence, the actual increase in production in the structure
relative to its immediate surroundings must be much higher. Although no published
test of the parameter space has been made, this suggests that there are limits to how
bright these structures can become with this mechanism. We shall see extreme
examples of this in the next sub-section.
A way around this is either to enhance the dust only or to modify the local dust
size distribution so that the scattering properties are changed. This implies that the
Fig. 4.38 The centre panel shows the distribution of dust aroud the nucleus at three different
distances
from
the
nucleus
centre
on
29
April
2015
at
16:04:09
(W20150429T160409605ID30F18). The original image is shown to the right. The nucleus casts
a shadow on dust in the coma which is evident also in the centre panel. The left panel shows the
change in the azimuthal average (solid line) with distance from the centre of the nucleus and also
shows azimuthal average values restricted to the projected dayside (dashed line) and the nightside
(dot-dash) hemispheres. The plot shows the dust brightness multiplied by the distance from the
centre of the nucleus in units of reflectance x metres. The Sun direction is marked by the vertical line
in the centre panel
344
4 Dust Emission from the Surface