

the nucleus at the time of these observations with a high eaf (Marschall et al. 2016;
Fougere et al. 2016). Figure 3.35 was acquired closer to perihelion and shows
rougher terrain. Once again, at shadow boundaries brighter deposits are evident.
Fornasier et al. (2016) used a time series showing the retreat and disappearance of a
condensate to estimate its thickness and concluded that the covering was equivalent
to 10–15 μm of solid ice.
Liao et al. (2018) used a DSMC code and determined the returning flux of
molecules impacting facets that were set to being inactive (and thus equivalent to
being in shadow). It was shown that condensation at the rates needed to match the
condensate thickness estimated by Fornasier et al. (2016) were indeed plausible.
An alternative explanation for the observations has been presented by De Sanctis
et al. (2015) who proposed a model whereby thermal inertia maintains sub-surface
sublimation for a short time after local sunset. The surface then is colder than the
sub-surface and sub-surface generated molecules condense at the surface as a frost
before being exposed to sunlight the following day. This was supported by a
numerical simulation (see Huebner et al. 2006) similar to that of the Marboeuf
et al. (2012) model discussed above.
It is difficult to distinguish between these two explanations. Both mechanisms
have been modelled numerically and shown to be feasible on the basis of current
knowledge and indeed both may be active depending upon the precise geometry and
the structure of the sub-surface. Some effort to use the existing data sets to study the
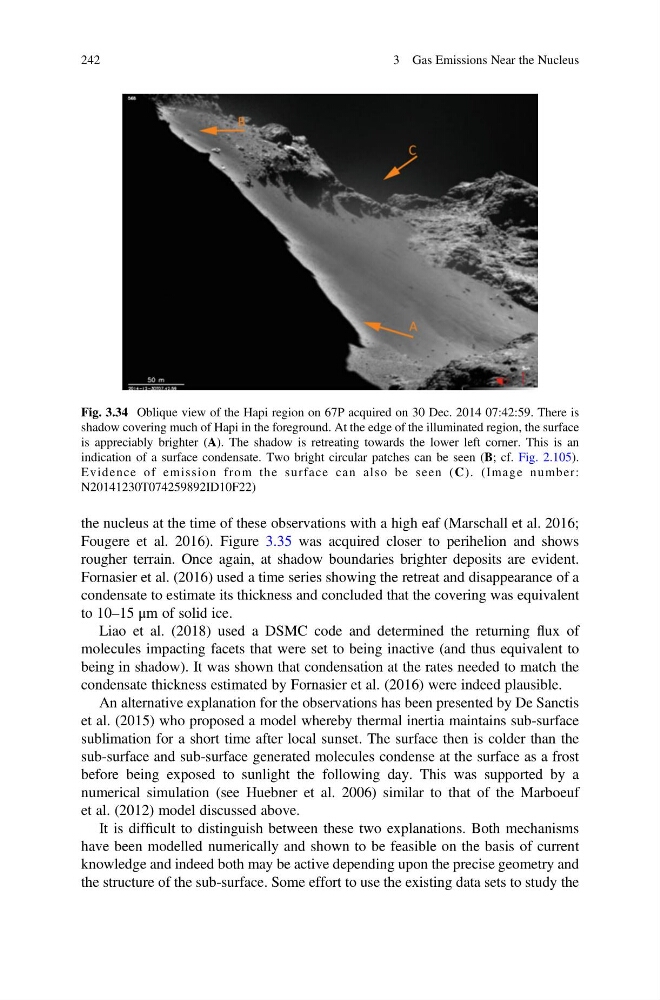
Fig. 3.34 Oblique view of the Hapi region on 67P acquired on 30 Dec. 2014 07:42:59. There is
shadow covering much of Hapi in the foreground. At the edge of the illuminated region, the surface
is appreciably brighter (A). The shadow is retreating towards the lower left corner. This is an
indication of a surface condensate. Two bright circular patches can be seen (B; cf. Fig. 2.105).
Evidence of emission from the surface can also be seen (C). (Image number:
N20141230T074259892ID10F22)
242
3 Gas Emissions Near the Nucleus
Fougere et al. 2016). Figure 3.35 was acquired closer to perihelion and shows
rougher terrain. Once again, at shadow boundaries brighter deposits are evident.
Fornasier et al. (2016) used a time series showing the retreat and disappearance of a
condensate to estimate its thickness and concluded that the covering was equivalent
to 10–15 μm of solid ice.
Liao et al. (2018) used a DSMC code and determined the returning flux of
molecules impacting facets that were set to being inactive (and thus equivalent to
being in shadow). It was shown that condensation at the rates needed to match the
condensate thickness estimated by Fornasier et al. (2016) were indeed plausible.
An alternative explanation for the observations has been presented by De Sanctis
et al. (2015) who proposed a model whereby thermal inertia maintains sub-surface
sublimation for a short time after local sunset. The surface then is colder than the
sub-surface and sub-surface generated molecules condense at the surface as a frost
before being exposed to sunlight the following day. This was supported by a
numerical simulation (see Huebner et al. 2006) similar to that of the Marboeuf
et al. (2012) model discussed above.
It is difficult to distinguish between these two explanations. Both mechanisms
have been modelled numerically and shown to be feasible on the basis of current
knowledge and indeed both may be active depending upon the precise geometry and
the structure of the sub-surface. Some effort to use the existing data sets to study the
Fig. 3.34 Oblique view of the Hapi region on 67P acquired on 30 Dec. 2014 07:42:59. There is
shadow covering much of Hapi in the foreground. At the edge of the illuminated region, the surface
is appreciably brighter (A). The shadow is retreating towards the lower left corner. This is an
indication of a surface condensate. Two bright circular patches can be seen (B; cf. Fig. 2.105).
Evidence of emission from the surface can also be seen (C). (Image number:
N20141230T074259892ID10F22)
242
3 Gas Emissions Near the Nucleus