

The soil organic carbon content level in mineral soil normally is high, 2–8%.
However, in suboptimal land, because the soils contain very poor organic matter, it
results in land degradation and decrease in soil fertility and plant productivity which
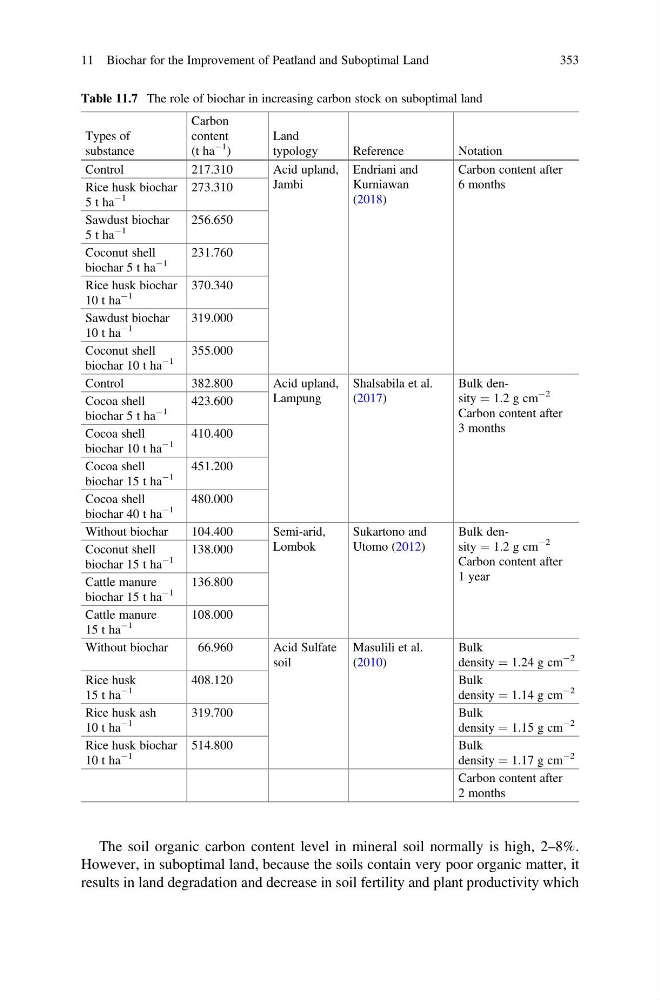
Table 11.7 The role of biochar in increasing carbon stock on suboptimal land
Types of
substance
Carbon
content
(t ha
À1
)
Land
typology
Reference
Notation
Control
217.310
Acid upland,
Jambi
Endriani and
Kurniawan
(2018)
Carbon content after
6 months
Rice husk biochar
5 t ha
À1
273.310
Sawdust biochar
5 t ha
À1
256.650
Coconut shell
biochar 5 t ha
À1
231.760
Rice husk biochar
10 t ha
À1
370.340
Sawdust biochar
10 t ha
À1
319.000
Coconut shell
biochar 10 t ha
À1
355.000
Control
382.800
Acid upland,
Lampung
Shalsabila et al.
(2017)
Bulk density ¼ 1.2 g cm
À2
Carbon content after
3 months
Cocoa shell
biochar 5 t ha
À1
423.600
Cocoa shell
biochar 10 t ha
À1
410.400
Cocoa shell
biochar 15 t ha
À1
451.200
Cocoa shell
biochar 40 t ha
À1
480.000
Without biochar
104.400
Semi-arid,
Lombok
Sukartono and
Utomo (2012)
Bulk density ¼ 1.2 g cm
À2
Carbon content after
1 year
Coconut shell
biochar 15 t ha
À1
138.000
Cattle manure
biochar 15 t ha
À1
136.800
Cattle manure
15 t ha
À1
108.000
Without biochar
66.960
Acid Sulfate
soil
Masulili et al.
(2010)
Bulk
density ¼ 1.24 g cm
À2
Rice husk
15 t ha
À1
408.120
Bulk
density ¼ 1.14 g cm
À2
Rice husk ash
10 t ha
À1
319.700
Bulk
density ¼ 1.15 g cm
À2
Rice husk biochar
10 t ha
À1
514.800
Bulk
density ¼ 1.17 g cm
À2
Carbon content after
2 months
11 Biochar for the Improvement of Peatland and Suboptimal Land
353
However, in suboptimal land, because the soils contain very poor organic matter, it
results in land degradation and decrease in soil fertility and plant productivity which
Table 11.7 The role of biochar in increasing carbon stock on suboptimal land
Types of
substance
Carbon
content
(t ha
À1
)
Land
typology
Reference
Notation
Control
217.310
Acid upland,
Jambi
Endriani and
Kurniawan
(2018)
Carbon content after
6 months
Rice husk biochar
5 t ha
À1
273.310
Sawdust biochar
5 t ha
À1
256.650
Coconut shell
biochar 5 t ha
À1
231.760
Rice husk biochar
10 t ha
À1
370.340
Sawdust biochar
10 t ha
À1
319.000
Coconut shell
biochar 10 t ha
À1
355.000
Control
382.800
Acid upland,
Lampung
Shalsabila et al.
(2017)
Bulk density ¼ 1.2 g cm
À2
Carbon content after
3 months
Cocoa shell
biochar 5 t ha
À1
423.600
Cocoa shell
biochar 10 t ha
À1
410.400
Cocoa shell
biochar 15 t ha
À1
451.200
Cocoa shell
biochar 40 t ha
À1
480.000
Without biochar
104.400
Semi-arid,
Lombok
Sukartono and
Utomo (2012)
Bulk density ¼ 1.2 g cm
À2
Carbon content after
1 year
Coconut shell
biochar 15 t ha
À1
138.000
Cattle manure
biochar 15 t ha
À1
136.800
Cattle manure
15 t ha
À1
108.000
Without biochar
66.960
Acid Sulfate
soil
Masulili et al.
(2010)
Bulk
density ¼ 1.24 g cm
À2
Rice husk
15 t ha
À1
408.120
Bulk
density ¼ 1.14 g cm
À2
Rice husk ash
10 t ha
À1
319.700
Bulk
density ¼ 1.15 g cm
À2
Rice husk biochar
10 t ha
À1
514.800
Bulk
density ¼ 1.17 g cm
À2
Carbon content after
2 months
11 Biochar for the Improvement of Peatland and Suboptimal Land
353