

utilized in the industry of biological fertilizer production. Biochar can be a good
microbial carrier due to high moisture content and slower releasing minerals (Thies
and Rillig 2009). Soil microbial population will be affected by the quality and
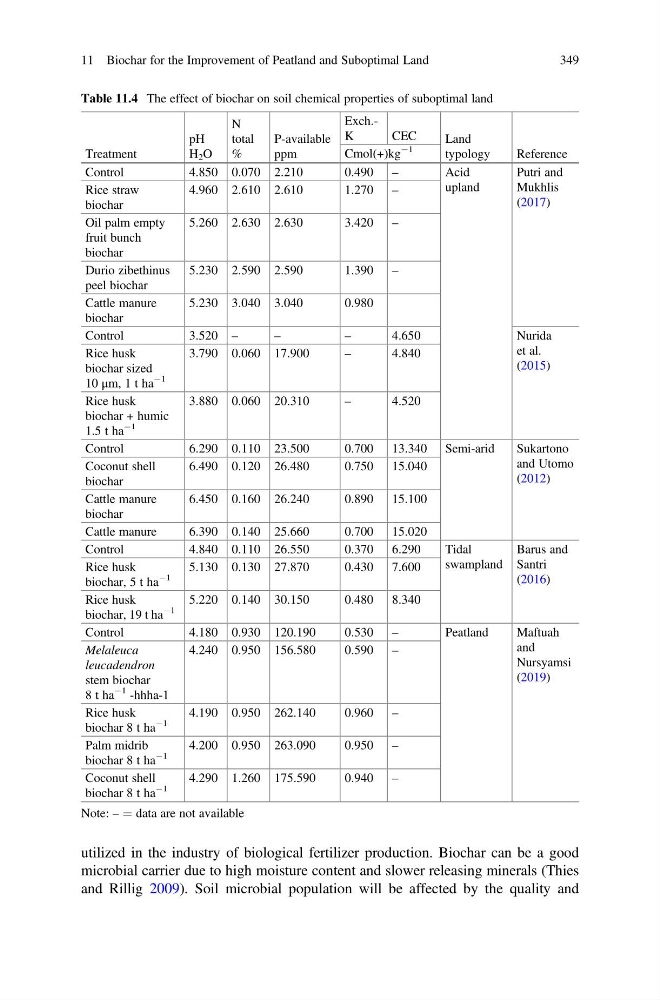
Table 11.4 The effect of biochar on soil chemical properties of suboptimal land
Treatment
pH
H 2 O
N
total
%
P-available
ppm
Exch.K
CEC
Land
typology
Reference
Cmol(+)kg
À1
Control
4.850 0.070 2.210
0.490 –
Acid
upland
Putri and
Mukhlis
(2017)
Rice straw
biochar
4.960 2.610 2.610
1.270 –
Oil palm empty
fruit bunch
biochar
5.260 2.630 2.630
3.420 –
Durio zibethinus
peel biochar
5.230 2.590 2.590
1.390 –
Cattle manure
biochar
5.230 3.040 3.040
0.980
Control
3.520 –
–
–
4.650
Nurida
et al.
(2015)
Rice husk
biochar sized
10 μm, 1 t ha
À1
3.790 0.060 17.900
–
4.840
Rice husk
biochar + humic
1.5 t ha
À1
3.880 0.060 20.310
–
4.520
Control
6.290 0.110 23.500
0.700 13.340 Semi-arid
Sukartono
and Utomo
(2012)
Coconut shell
biochar
6.490 0.120 26.480
0.750 15.040
Cattle manure
biochar
6.450 0.160 26.240
0.890 15.100
Cattle manure
6.390 0.140 25.660
0.700 15.020
Control
4.840 0.110 26.550
0.370 6.290
Tidal
swampland
Barus and
Santri
(2016)
Rice husk
biochar, 5 t ha
À1
5.130 0.130 27.870
0.430 7.600
Rice husk
biochar, 19 t ha
À1
5.220 0.140 30.150
0.480 8.340
Control
4.180 0.930 120.190
0.530 –
Peatland
Maftuah
and
Nursyamsi
(2019)
Melaleuca
leucadendron
stem biochar
8 t ha
À1 -hhha-1
4.240 0.950 156.580
0.590 –
Rice husk
biochar 8 t ha
À1
4.190 0.950 262.140
0.960 –
Palm midrib
biochar 8 t ha
À1
4.200 0.950 263.090
0.950 –
Coconut shell
biochar 8 t ha
À1
4.290 1.260 175.590
0.940 –
Note: – ¼ data are not available
11 Biochar for the Improvement of Peatland and Suboptimal Land
349
microbial carrier due to high moisture content and slower releasing minerals (Thies
and Rillig 2009). Soil microbial population will be affected by the quality and
Table 11.4 The effect of biochar on soil chemical properties of suboptimal land
Treatment
pH
H 2 O
N
total
%
P-available
ppm
Exch.K
CEC
Land
typology
Reference
Cmol(+)kg
À1
Control
4.850 0.070 2.210
0.490 –
Acid
upland
Putri and
Mukhlis
(2017)
Rice straw
biochar
4.960 2.610 2.610
1.270 –
Oil palm empty
fruit bunch
biochar
5.260 2.630 2.630
3.420 –
Durio zibethinus
peel biochar
5.230 2.590 2.590
1.390 –
Cattle manure
biochar
5.230 3.040 3.040
0.980
Control
3.520 –
–
–
4.650
Nurida
et al.
(2015)
Rice husk
biochar sized
10 μm, 1 t ha
À1
3.790 0.060 17.900
–
4.840
Rice husk
biochar + humic
1.5 t ha
À1
3.880 0.060 20.310
–
4.520
Control
6.290 0.110 23.500
0.700 13.340 Semi-arid
Sukartono
and Utomo
(2012)
Coconut shell
biochar
6.490 0.120 26.480
0.750 15.040
Cattle manure
biochar
6.450 0.160 26.240
0.890 15.100
Cattle manure
6.390 0.140 25.660
0.700 15.020
Control
4.840 0.110 26.550
0.370 6.290
Tidal
swampland
Barus and
Santri
(2016)
Rice husk
biochar, 5 t ha
À1
5.130 0.130 27.870
0.430 7.600
Rice husk
biochar, 19 t ha
À1
5.220 0.140 30.150
0.480 8.340
Control
4.180 0.930 120.190
0.530 –
Peatland
Maftuah
and
Nursyamsi
(2019)
Melaleuca
leucadendron
stem biochar
8 t ha
À1 -hhha-1
4.240 0.950 156.580
0.590 –
Rice husk
biochar 8 t ha
À1
4.190 0.950 262.140
0.960 –
Palm midrib
biochar 8 t ha
À1
4.200 0.950 263.090
0.950 –
Coconut shell
biochar 8 t ha
À1
4.290 1.260 175.590
0.940 –
Note: – ¼ data are not available
11 Biochar for the Improvement of Peatland and Suboptimal Land
349