

5.5.3 Verification Among Carbon Emission Models
Moreover, CO 2 emissions from large-scale areas can be estimated with satellite
monitoring systems (Satellite GOSAT "IBUKI" sensing) [inverse model] and a
simulation model by SimCYCLE-VISIT for East Asia [simulation model] (Ito and
Oikawa 2002) (Fig. 5.7). Furthermore, a model of CO 2 emission is developed based
on peatland subsidence. The peatland subsidence can be estimated from
(1) ground-based point observation of the GWL (by pole measurement) and land
subsidence (by laser distance meter) and (2) interferometric SAR (InSAR) analysis.
The land subsidence is negatively related to GWL, and by using this coefficient to
map the GWL, a map of land subsidence can be obtained [subsidence model], which
is converted into a CO 2 emission map by calculating the CO 2 conversion factor of
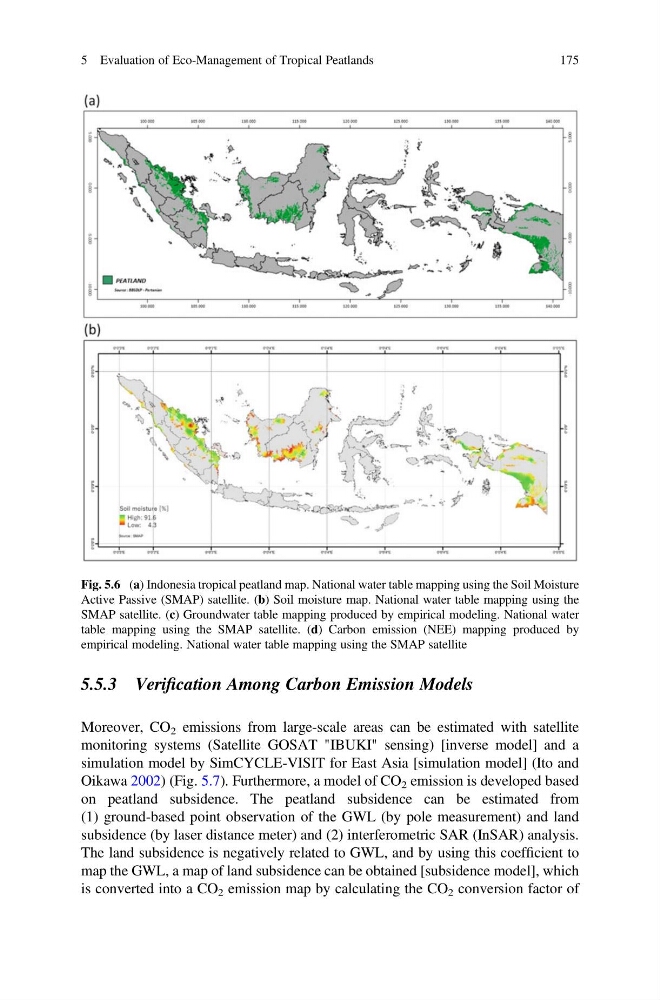
Fig. 5.6 (a) Indonesia tropical peatland map. National water table mapping using the Soil Moisture
Active Passive (SMAP) satellite. (b) Soil moisture map. National water table mapping using the
SMAP satellite. (c) Groundwater table mapping produced by empirical modeling. National water
table mapping using the SMAP satellite. (d) Carbon emission (NEE) mapping produced by
empirical modeling. National water table mapping using the SMAP satellite
5 Evaluation of Eco-Management of Tropical Peatlands
175
Moreover, CO 2 emissions from large-scale areas can be estimated with satellite
monitoring systems (Satellite GOSAT "IBUKI" sensing) [inverse model] and a
simulation model by SimCYCLE-VISIT for East Asia [simulation model] (Ito and
Oikawa 2002) (Fig. 5.7). Furthermore, a model of CO 2 emission is developed based
on peatland subsidence. The peatland subsidence can be estimated from
(1) ground-based point observation of the GWL (by pole measurement) and land
subsidence (by laser distance meter) and (2) interferometric SAR (InSAR) analysis.
The land subsidence is negatively related to GWL, and by using this coefficient to
map the GWL, a map of land subsidence can be obtained [subsidence model], which
is converted into a CO 2 emission map by calculating the CO 2 conversion factor of
Fig. 5.6 (a) Indonesia tropical peatland map. National water table mapping using the Soil Moisture
Active Passive (SMAP) satellite. (b) Soil moisture map. National water table mapping using the
SMAP satellite. (c) Groundwater table mapping produced by empirical modeling. National water
table mapping using the SMAP satellite. (d) Carbon emission (NEE) mapping produced by
empirical modeling. National water table mapping using the SMAP satellite
5 Evaluation of Eco-Management of Tropical Peatlands
175