

584
K. Kleinknecht and U. Uwer
where θ 1,2 are the B meson production angles relative to the e + direction. The
flavors of the two mesons are thus fully correlated until the first meson decays at
time t 1 . If at that time this meson is a B 0 the flavor of the second meson is fixed to
be a B 0 and vice versa. The time evolution of the second B meson with decay time
t 2 is then given by
ψ 2 (t 2 ) = B 0
e
−γ h (t 2 −t 1 )
+ e
−γ l (t 2 −t 1 )
−
q
p
B
0
e
−γ h (t 2 −t 1 )
− e
−γ l (t 2 −t 1 )
,
(9.200)
i.e. the time evolution of the flavor of the second B meson is defined by the time
difference = t 2 − t 1 between the two decays. Depending on which of the two B
mesons is studied, t can also be negative.
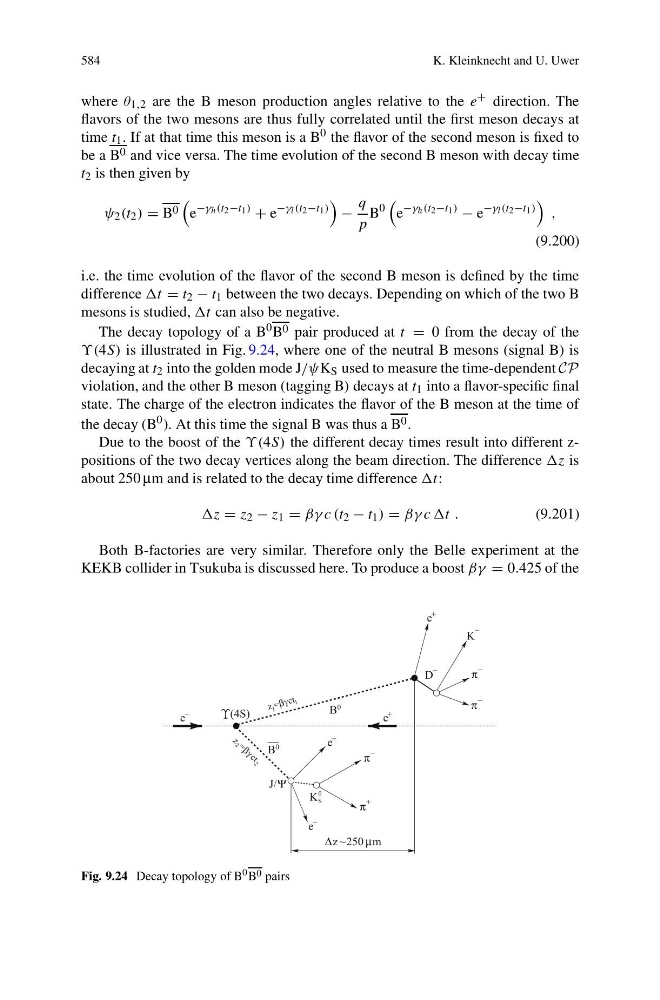
The decay topology of a B 0 B 0 pair produced at t = 0 from the decay of the
ϒ(4S) is illustrated in Fig. 9.24, where one of the neutral B mesons (signal B) is
decaying at t 2 into the golden mode J/ψK S used to measure the time-dependent CP
violation, and the other B meson (tagging B) decays at t 1 into a flavor-specific final
state. The charge of the electron indicates the flavor of the B meson at the time of
the decay (B 0 ). At this time the signal B was thus a B 0 .
Due to the boost of the ϒ(4S) the different decay times result into different zpositions of the two decay vertices along the beam direction. The difference z is
about 250 μm and is related to the decay time difference
= z 2 − z 1 = βγ c (t 2 − t 1 ) = βγ c ct .
(9.201)
Both B-factories are very similar. Therefore only the Belle experiment at the
KEKB collider in Tsukuba is discussed here. To produce a boost βγ = 0.425 of the
Fig. 9.24 Decay topology of B 0 B 0 pairs
K. Kleinknecht and U. Uwer
where θ 1,2 are the B meson production angles relative to the e + direction. The
flavors of the two mesons are thus fully correlated until the first meson decays at
time t 1 . If at that time this meson is a B 0 the flavor of the second meson is fixed to
be a B 0 and vice versa. The time evolution of the second B meson with decay time
t 2 is then given by
ψ 2 (t 2 ) = B 0
e
−γ h (t 2 −t 1 )
+ e
−γ l (t 2 −t 1 )
−
q
p
B
0
e
−γ h (t 2 −t 1 )
− e
−γ l (t 2 −t 1 )
,
(9.200)
i.e. the time evolution of the flavor of the second B meson is defined by the time
difference = t 2 − t 1 between the two decays. Depending on which of the two B
mesons is studied, t can also be negative.
The decay topology of a B 0 B 0 pair produced at t = 0 from the decay of the
ϒ(4S) is illustrated in Fig. 9.24, where one of the neutral B mesons (signal B) is
decaying at t 2 into the golden mode J/ψK S used to measure the time-dependent CP
violation, and the other B meson (tagging B) decays at t 1 into a flavor-specific final
state. The charge of the electron indicates the flavor of the B meson at the time of
the decay (B 0 ). At this time the signal B was thus a B 0 .
Due to the boost of the ϒ(4S) the different decay times result into different zpositions of the two decay vertices along the beam direction. The difference z is
about 250 μm and is related to the decay time difference
= z 2 − z 1 = βγ c (t 2 − t 1 ) = βγ c ct .
(9.201)
Both B-factories are very similar. Therefore only the Belle experiment at the
KEKB collider in Tsukuba is discussed here. To produce a boost βγ = 0.425 of the
Fig. 9.24 Decay topology of B 0 B 0 pairs