

7 Relativistic Nucleus-Nucleus Collisions and the QCD Matter Phase Diagram
413
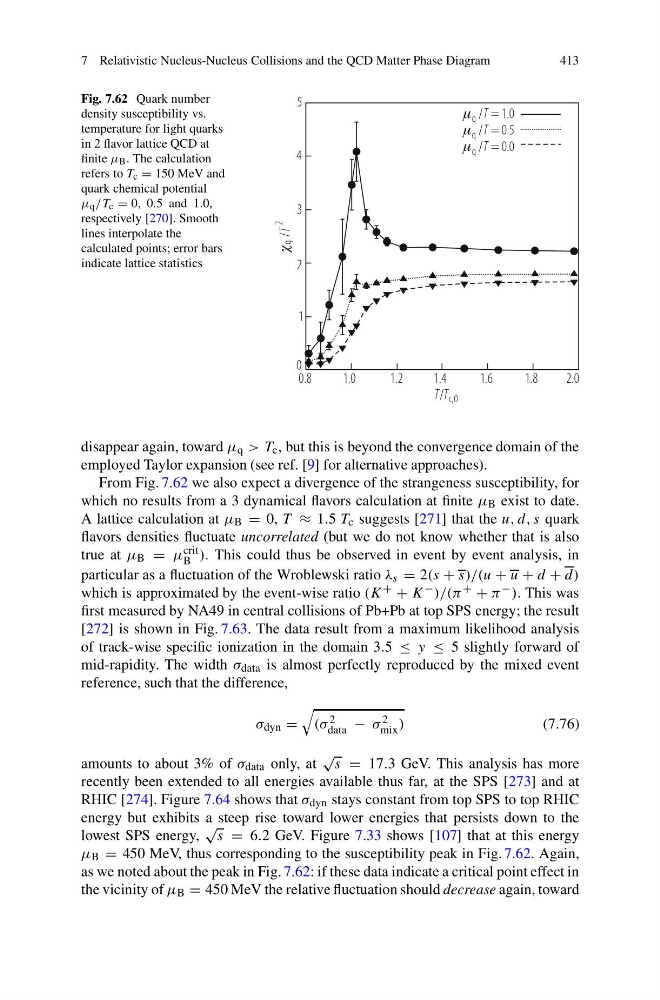
Fig. 7.62 Quark number
density susceptibility vs.
temperature for light quarks
in 2 flavor lattice QCD at
finite μ B . The calculation
refers to T c = 150 MeV and
quark chemical potential
μ q /T c = 0, 0.5 and 1.0,
respectively [270]. Smooth
lines interpolate the
calculated points; error bars
indicate lattice statistics
0
1
2
3
4
5
0.8
1.0
1.2
1.4
1.6
1.8
2.0
T T
/ c,0
q
/T
2
q
q
q
/ = 1.0
/ = 0.5
/ = 0.0
T
T
T
disappear again, toward μ q > T c , but this is beyond the convergence domain of the
employed Taylor expansion (see ref. [9] for alternative approaches).
From Fig. 7.62 we also expect a divergence of the strangeness susceptibility, for
which no results from a 3 dynamical flavors calculation at finite μ B exist to date.
A lattice calculation at μ B = 0, T ≈ 1.5 T c suggests [271] that the u, d, s quark
flavors densities fluctuate uncorrelated (but we do not know whether that is also
true at μ B = μ crit
B ). This could thus be observed in event by event analysis, in
particular as a fluctuation of the Wroblewski ratio λ s = 2(s + s)/(u + u + d + d)
which is approximated by the event-wise ratio (K + + K − )/(π + + π − ). This was
first measured by NA49 in central collisions of Pb+Pb at top SPS energy; the result
[272] is shown in Fig. 7.63. The data result from a maximum likelihood analysis
of track-wise specific ionization in the domain 3.5 ≤ y ≤ 5 slightly forward of
mid-rapidity. The width σ data is almost perfectly reproduced by the mixed event
reference, such that the difference,
σ dyn =
(σ 2
data − σ 2
mix )
(7.76)
amounts to about 3% of σ data only, at
√
s = 17.3 GeV. This analysis has more
recently been extended to all energies available thus far, at the SPS [273] and at
RHIC [274]. Figure 7.64 shows that σ dyn stays constant from top SPS to top RHIC
energy but exhibits a steep rise toward lower energies that persists down to the
lowest SPS energy,
√
s = 6.2 GeV. Figure 7.33 shows [107] that at this energy
μ B = 450 MeV, thus corresponding to the susceptibility peak in Fig. 7.62. Again,
as we noted about the peak in Fig. 7.62: if these data indicate a critical point effect in
the vicinity of μ B = 450 MeV the relative fluctuation should decrease again, toward
413
Fig. 7.62 Quark number
density susceptibility vs.
temperature for light quarks
in 2 flavor lattice QCD at
finite μ B . The calculation
refers to T c = 150 MeV and
quark chemical potential
μ q /T c = 0, 0.5 and 1.0,
respectively [270]. Smooth
lines interpolate the
calculated points; error bars
indicate lattice statistics
0
1
2
3
4
5
0.8
1.0
1.2
1.4
1.6
1.8
2.0
T T
/ c,0
q
/T
2
q
q
q
/ = 1.0
/ = 0.5
/ = 0.0
T
T
T
disappear again, toward μ q > T c , but this is beyond the convergence domain of the
employed Taylor expansion (see ref. [9] for alternative approaches).
From Fig. 7.62 we also expect a divergence of the strangeness susceptibility, for
which no results from a 3 dynamical flavors calculation at finite μ B exist to date.
A lattice calculation at μ B = 0, T ≈ 1.5 T c suggests [271] that the u, d, s quark
flavors densities fluctuate uncorrelated (but we do not know whether that is also
true at μ B = μ crit
B ). This could thus be observed in event by event analysis, in
particular as a fluctuation of the Wroblewski ratio λ s = 2(s + s)/(u + u + d + d)
which is approximated by the event-wise ratio (K + + K − )/(π + + π − ). This was
first measured by NA49 in central collisions of Pb+Pb at top SPS energy; the result
[272] is shown in Fig. 7.63. The data result from a maximum likelihood analysis
of track-wise specific ionization in the domain 3.5 ≤ y ≤ 5 slightly forward of
mid-rapidity. The width σ data is almost perfectly reproduced by the mixed event
reference, such that the difference,
σ dyn =
(σ 2
data − σ 2
mix )
(7.76)
amounts to about 3% of σ data only, at
√
s = 17.3 GeV. This analysis has more
recently been extended to all energies available thus far, at the SPS [273] and at
RHIC [274]. Figure 7.64 shows that σ dyn stays constant from top SPS to top RHIC
energy but exhibits a steep rise toward lower energies that persists down to the
lowest SPS energy,
√
s = 6.2 GeV. Figure 7.33 shows [107] that at this energy
μ B = 450 MeV, thus corresponding to the susceptibility peak in Fig. 7.62. Again,
as we noted about the peak in Fig. 7.62: if these data indicate a critical point effect in
the vicinity of μ B = 450 MeV the relative fluctuation should decrease again, toward