

338
R. Stock
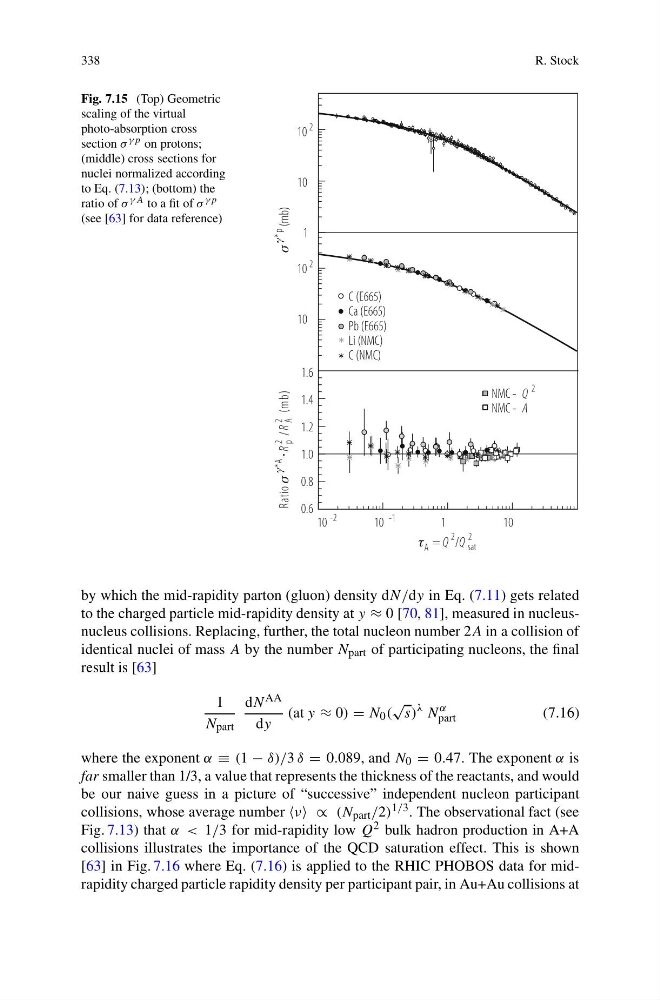
Fig. 7.15 (Top) Geometric
scaling of the virtual
photo-absorption cross
section σ γp on protons;
(middle) cross sections for
nuclei normalized according
to Eq. (7.13); (bottom) the
ratio of σ γ A to a fit of σ γp
(see [63] for data reference)
10
10
1
2
10
10
2
1.6
1.4
1.2
1.0
0.8
0.6
10
10
1
10
-2
-1
A
2 2
sat
= /
Q Q
NMC -
NMC -
Q
A
2
C (E665)
Ca (E665)
Pb (E665)
Li (NMC)
C (NMC)
* p
)
b
m
(
)
b
m
(
/
o
i
t
a
R
2
A
* p
2 A
R
R
by which the mid-rapidity parton (gluon) density dN/dy in Eq. (7.11) gets related
to the charged particle mid-rapidity density at y ≈ 0 [70, 81], measured in nucleusnucleus collisions. Replacing, further, the total nucleon number 2A in a collision of
identical nuclei of mass A by the number N part of participating nucleons, the final
result is [63]
1
N part
dN AA
dy
(at y ≈ 0) = N 0 (
√
s)
λ N
α
part
(7.16)
where the exponent α ≡ (1 − δ)/3 δ = 0.089, and N 0 = 0.47. The exponent α is
far smaller than 1/3, a value that represents the thickness of the reactants, and would
be our naive guess in a picture of “successive” independent nucleon participant
collisions, whose average number ν ∝ (N part /2) 1/3 . The observational fact (see
Fig. 7.13) that α < 1/3 for mid-rapidity low Q 2 bulk hadron production in A+A
collisions illustrates the importance of the QCD saturation effect. This is shown
[63] in Fig. 7.16 where Eq. (7.16) is applied to the RHIC PHOBOS data for midrapidity charged particle rapidity density per participant pair, in Au+Au collisions at
R. Stock
Fig. 7.15 (Top) Geometric
scaling of the virtual
photo-absorption cross
section σ γp on protons;
(middle) cross sections for
nuclei normalized according
to Eq. (7.13); (bottom) the
ratio of σ γ A to a fit of σ γp
(see [63] for data reference)
10
10
1
2
10
10
2
1.6
1.4
1.2
1.0
0.8
0.6
10
10
1
10
-2
-1
A
2 2
sat
= /
Q Q
NMC -
NMC -
Q
A
2
C (E665)
Ca (E665)
Pb (E665)
Li (NMC)
C (NMC)
* p
)
b
m
(
)
b
m
(
/
o
i
t
a
R
2
A
* p
2 A
R
R
by which the mid-rapidity parton (gluon) density dN/dy in Eq. (7.11) gets related
to the charged particle mid-rapidity density at y ≈ 0 [70, 81], measured in nucleusnucleus collisions. Replacing, further, the total nucleon number 2A in a collision of
identical nuclei of mass A by the number N part of participating nucleons, the final
result is [63]
1
N part
dN AA
dy
(at y ≈ 0) = N 0 (
√
s)
λ N
α
part
(7.16)
where the exponent α ≡ (1 − δ)/3 δ = 0.089, and N 0 = 0.47. The exponent α is
far smaller than 1/3, a value that represents the thickness of the reactants, and would
be our naive guess in a picture of “successive” independent nucleon participant
collisions, whose average number ν ∝ (N part /2) 1/3 . The observational fact (see
Fig. 7.13) that α < 1/3 for mid-rapidity low Q 2 bulk hadron production in A+A
collisions illustrates the importance of the QCD saturation effect. This is shown
[63] in Fig. 7.16 where Eq. (7.16) is applied to the RHIC PHOBOS data for midrapidity charged particle rapidity density per participant pair, in Au+Au collisions at