

298
P. Jenni and T. S. Virdee
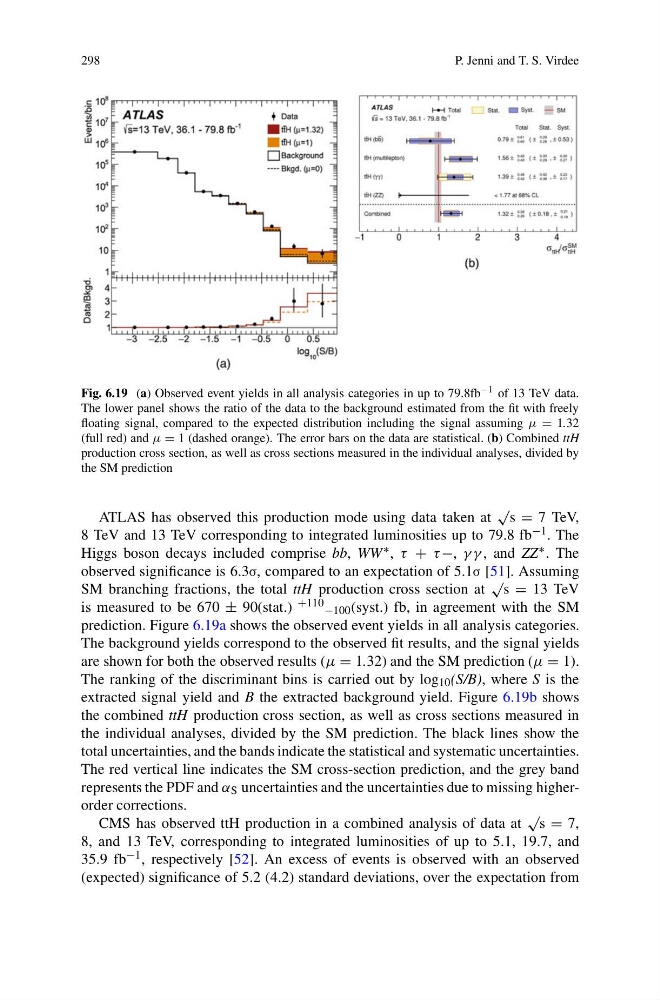
Fig. 6.19 (a) Observed event yields in all analysis categories in up to 79.8fb −1 of 13 TeV data.
The lower panel shows the ratio of the data to the background estimated from the fit with freely
floating signal, compared to the expected distribution including the signal assuming μ = 1.32
(full red) and μ = 1 (dashed orange). The error bars on the data are statistical. (b) Combined ttH
production cross section, as well as cross sections measured in the individual analyses, divided by
the SM prediction
ATLAS has observed this production mode using data taken at
√ s = 7 TeV,
8 TeV and 13 TeV corresponding to integrated luminosities up to 79.8 fb −1 . The
Higgs boson decays included comprise bb, WW ∗ , τ + τ −, γ γ , and ZZ ∗ . The
observed significance is 6.3σ, compared to an expectation of 5.1σ [51]. Assuming
SM branching fractions, the total ttH production cross section at
√
s = 13 TeV
is measured to be 670 ± 90(stat.) +110 −100 (syst.) fb, in agreement with the SM
prediction. Figure 6.19a shows the observed event yields in all analysis categories.
The background yields correspond to the observed fit results, and the signal yields
are shown for both the observed results (μ = 1.32) and the SM prediction (μ = 1).
The ranking of the discriminant bins is carried out by log 10 (S/B), where S is the
extracted signal yield and B the extracted background yield. Figure 6.19b shows
the combined ttH production cross section, as well as cross sections measured in
the individual analyses, divided by the SM prediction. The black lines show the
total uncertainties, and the bands indicate the statistical and systematic uncertainties.
The red vertical line indicates the SM cross-section prediction, and the grey band
represents the PDF and α S uncertainties and the uncertainties due to missing higherorder corrections.
CMS has observed ttH production in a combined analysis of data at
√
s = 7,
8, and 13 TeV, corresponding to integrated luminosities of up to 5.1, 19.7, and
35.9 fb −1 , respectively [52]. An excess of events is observed with an observed
(expected) significance of 5.2 (4.2) standard deviations, over the expectation from
P. Jenni and T. S. Virdee
Fig. 6.19 (a) Observed event yields in all analysis categories in up to 79.8fb −1 of 13 TeV data.
The lower panel shows the ratio of the data to the background estimated from the fit with freely
floating signal, compared to the expected distribution including the signal assuming μ = 1.32
(full red) and μ = 1 (dashed orange). The error bars on the data are statistical. (b) Combined ttH
production cross section, as well as cross sections measured in the individual analyses, divided by
the SM prediction
ATLAS has observed this production mode using data taken at
√ s = 7 TeV,
8 TeV and 13 TeV corresponding to integrated luminosities up to 79.8 fb −1 . The
Higgs boson decays included comprise bb, WW ∗ , τ + τ −, γ γ , and ZZ ∗ . The
observed significance is 6.3σ, compared to an expectation of 5.1σ [51]. Assuming
SM branching fractions, the total ttH production cross section at
√
s = 13 TeV
is measured to be 670 ± 90(stat.) +110 −100 (syst.) fb, in agreement with the SM
prediction. Figure 6.19a shows the observed event yields in all analysis categories.
The background yields correspond to the observed fit results, and the signal yields
are shown for both the observed results (μ = 1.32) and the SM prediction (μ = 1).
The ranking of the discriminant bins is carried out by log 10 (S/B), where S is the
extracted signal yield and B the extracted background yield. Figure 6.19b shows
the combined ttH production cross section, as well as cross sections measured in
the individual analyses, divided by the SM prediction. The black lines show the
total uncertainties, and the bands indicate the statistical and systematic uncertainties.
The red vertical line indicates the SM cross-section prediction, and the grey band
represents the PDF and α S uncertainties and the uncertainties due to missing higherorder corrections.
CMS has observed ttH production in a combined analysis of data at
√
s = 7,
8, and 13 TeV, corresponding to integrated luminosities of up to 5.1, 19.7, and
35.9 fb −1 , respectively [52]. An excess of events is observed with an observed
(expected) significance of 5.2 (4.2) standard deviations, over the expectation from