

78
P. Lecoq
3.3.2.2 Defect Associated Absorption Bands
Defects have generally energy levels in the forbidden band, which reduce the
optical transparency of the crystal. Small perturbations of the crystal lattice are
energetically the most probable ones and give rise to a number of energy levels
near the conduction and the valence bands. There is nearly a continuum of such
levels, which reduces the optical transparency window of the crystal. For this reason,
the shape of the optical transmission of a crystal near the band-edge is usually
a good probe of its structural quality. Crystals with UV emission bands near the
fundamental absorption edge are strongly affected by the optical transitions between
these levels resulting in increased absorption.
Cross-luminescent crystals such as Barium Fluoride (BaF 2 ) are illustrative
examples to demonstrate the role of impurities on the crystal properties. Their deep
UV fast emission band (220 nm for BaF 2 ) requires a very good UV transmission to
detect efficiently the light at the photodetector. Unfortunately, alkali earth fluorides
are easily contaminated by oxygen and hydroxyl ions, causing strong absorption
bands in the UV. A theoretical study of the charge state stability and electronic
structure of O 0 , O − and O 2− centres in BaF 2 identified a large number of transitions
from 2p to 3s and 5s states. In ref. [28] Hartree-Fock-Slatter local density discrete
variation cluster calculations were made to obtain the energy levels of H s
− , O s
− and
O s
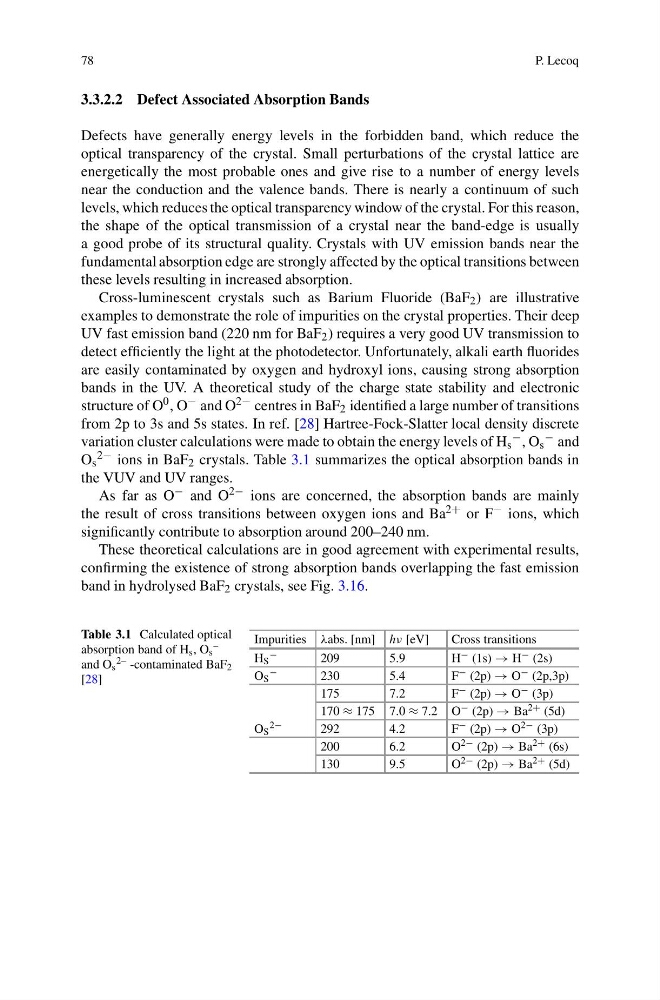
2− ions in BaF 2 crystals. Table 3.1 summarizes the optical absorption bands in
the VUV and UV ranges.
As far as O − and O 2− ions are concerned, the absorption bands are mainly
the result of cross transitions between oxygen ions and Ba 2+ or F − ions, which
significantly contribute to absorption around 200–240 nm.
These theoretical calculations are in good agreement with experimental results,
confirming the existence of strong absorption bands overlapping the fast emission
band in hydrolysed BaF 2 crystals, see Fig. 3.16.
Table 3.1 Calculated optical
absorption band of H s , O s
–
and O s
2– -contaminated BaF 2
[28]
Impurities λabs. [nm] hν [eV]
Cross transitions
H S
−
209
5.9
H − (1s) → H − (2s)
O S
−
230
5.4
F − (2p) → O − (2p,3p)
175
7.2
F − (2p) → O − (3p)
170 ≈ 175 7.0 ≈ 7.2 O − (2p) → Ba 2+ (5d)
O S
2−
292
4.2
F − (2p) → O 2− (3p)
200
6.2
O 2− (2p) → Ba 2+ (6s)
130
9.5
O 2− (2p) → Ba 2+ (5d)
P. Lecoq
3.3.2.2 Defect Associated Absorption Bands
Defects have generally energy levels in the forbidden band, which reduce the
optical transparency of the crystal. Small perturbations of the crystal lattice are
energetically the most probable ones and give rise to a number of energy levels
near the conduction and the valence bands. There is nearly a continuum of such
levels, which reduces the optical transparency window of the crystal. For this reason,
the shape of the optical transmission of a crystal near the band-edge is usually
a good probe of its structural quality. Crystals with UV emission bands near the
fundamental absorption edge are strongly affected by the optical transitions between
these levels resulting in increased absorption.
Cross-luminescent crystals such as Barium Fluoride (BaF 2 ) are illustrative
examples to demonstrate the role of impurities on the crystal properties. Their deep
UV fast emission band (220 nm for BaF 2 ) requires a very good UV transmission to
detect efficiently the light at the photodetector. Unfortunately, alkali earth fluorides
are easily contaminated by oxygen and hydroxyl ions, causing strong absorption
bands in the UV. A theoretical study of the charge state stability and electronic
structure of O 0 , O − and O 2− centres in BaF 2 identified a large number of transitions
from 2p to 3s and 5s states. In ref. [28] Hartree-Fock-Slatter local density discrete
variation cluster calculations were made to obtain the energy levels of H s
− , O s
− and
O s
2− ions in BaF 2 crystals. Table 3.1 summarizes the optical absorption bands in
the VUV and UV ranges.
As far as O − and O 2− ions are concerned, the absorption bands are mainly
the result of cross transitions between oxygen ions and Ba 2+ or F − ions, which
significantly contribute to absorption around 200–240 nm.
These theoretical calculations are in good agreement with experimental results,
confirming the existence of strong absorption bands overlapping the fast emission
band in hydrolysed BaF 2 crystals, see Fig. 3.16.
Table 3.1 Calculated optical
absorption band of H s , O s
–
and O s
2– -contaminated BaF 2
[28]
Impurities λabs. [nm] hν [eV]
Cross transitions
H S
−
209
5.9
H − (1s) → H − (2s)
O S
−
230
5.4
F − (2p) → O − (2p,3p)
175
7.2
F − (2p) → O − (3p)
170 ≈ 175 7.0 ≈ 7.2 O − (2p) → Ba 2+ (5d)
O S
2−
292
4.2
F − (2p) → O 2− (3p)
200
6.2
O 2− (2p) → Ba 2+ (6s)
130
9.5
O 2− (2p) → Ba 2+ (5d)