

706
D. Froidevaux
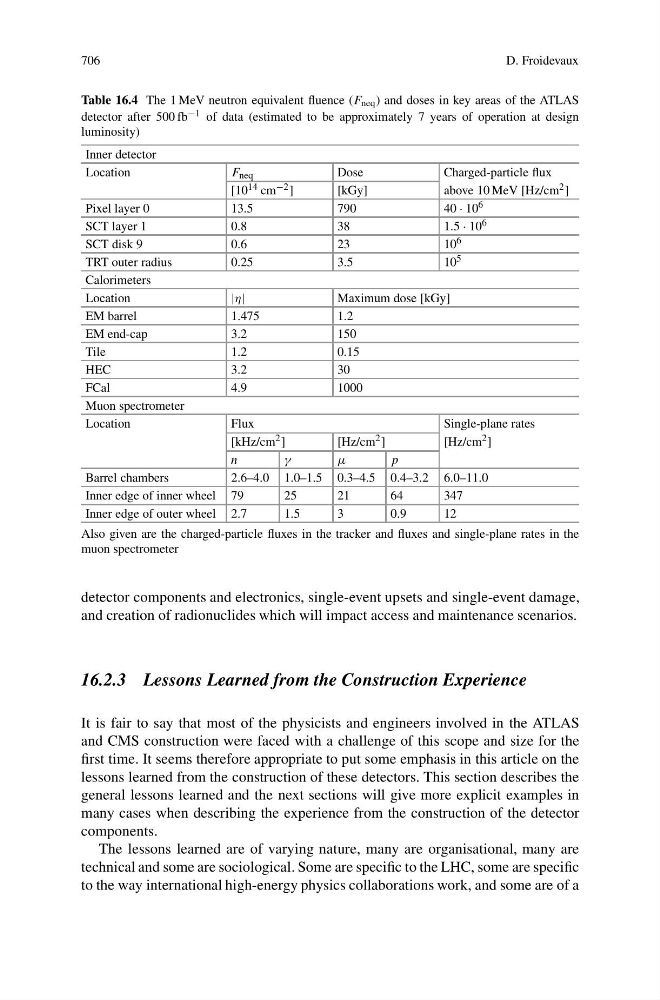
Table 16.4 The 1 MeV neutron equivalent fluence (F neq ) and doses in key areas of the ATLAS
detector after 500 fb −1 of data (estimated to be approximately 7 years of operation at design
luminosity)
Inner detector
Location
F neq
Dose
Charged-particle flux
[10 14 cm −2 ]
[kGy]
above 10 MeV [Hz/cm 2 ]
Pixel layer 0
13.5
790
40 · 10 6
SCT layer 1
0.8
38
1.5 · 10 6
SCT disk 9
0.6
23
10 6
TRT outer radius
0.25
3.5
10 5
Calorimeters
Location
|η|
Maximum dose [kGy]
EM barrel
1.475
1.2
EM end-cap
3.2
150
Tile
1.2
0.15
HEC
3.2
30
FCal
4.9
1000
Muon spectrometer
Location
Flux
Single-plane rates
[kHz/cm 2 ]
[Hz/cm 2 ]
[Hz/cm 2 ]
n
γ
μ
p
Barrel chambers
2.6–4.0 1.0–1.5 0.3–4.5 0.4–3.2 6.0–11.0
Inner edge of inner wheel 79
25
21
64
347
Inner edge of outer wheel 2.7
1.5
3
0.9
12
Also given are the charged-particle fluxes in the tracker and fluxes and single-plane rates in the
muon spectrometer
detector components and electronics, single-event upsets and single-event damage,
and creation of radionuclides which will impact access and maintenance scenarios.
16.2.3 Lessons Learned from the Construction Experience
It is fair to say that most of the physicists and engineers involved in the ATLAS
and CMS construction were faced with a challenge of this scope and size for the
first time. It seems therefore appropriate to put some emphasis in this article on the
lessons learned from the construction of these detectors. This section describes the
general lessons learned and the next sections will give more explicit examples in
many cases when describing the experience from the construction of the detector
components.
The lessons learned are of varying nature, many are organisational, many are
technical and some are sociological. Some are specific to the LHC, some are specific
to the way international high-energy physics collaborations work, and some are of a