

15 Statistical Issues in Particle Physics
659
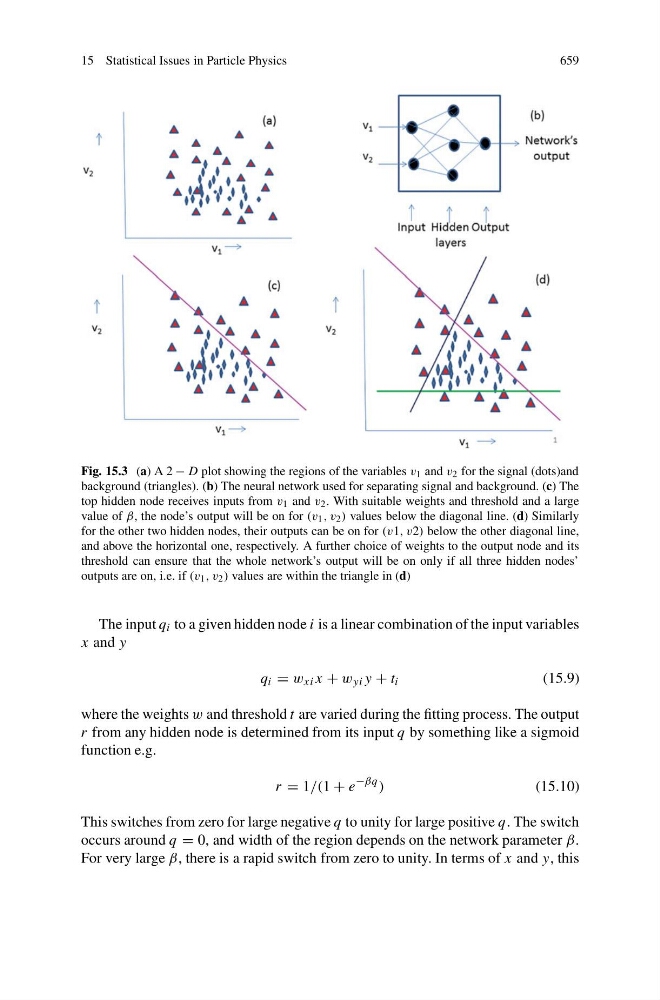
Fig. 15.3 (a) A 2 − D plot showing the regions of the variables v 1 and v 2 for the signal (dots)and
background (triangles). (b) The neural network used for separating signal and background. (c) The
top hidden node receives inputs from v 1 and v 2 . With suitable weights and threshold and a large
value of β, the node’s output will be on for (v 1 , v 2 ) values below the diagonal line. (d) Similarly
for the other two hidden nodes, their outputs can be on for (v1, v2) below the other diagonal line,
and above the horizontal one, respectively. A further choice of weights to the output node and its
threshold can ensure that the whole network’s output will be on only if all three hidden nodes’
outputs are on, i.e. if (v 1 , v 2 ) values are within the triangle in (d)
The input q i to a given hidden node i is a linear combination of the input variables
x and y
q i = w xi x + w yi y + t i
(15.9)
where the weights w and threshold t are varied during the fitting process. The output
r from any hidden node is determined from its input q by something like a sigmoid
function e.g.
r = 1/(1 + e
−βq )
(15.10)
This switches from zero for large negative q to unity for large positive q. The switch
occurs around q = 0, and width of the region depends on the network parameter β.
For very large β, there is a rapid switch from zero to unity. In terms of x and y, this