

650
L. Lyons
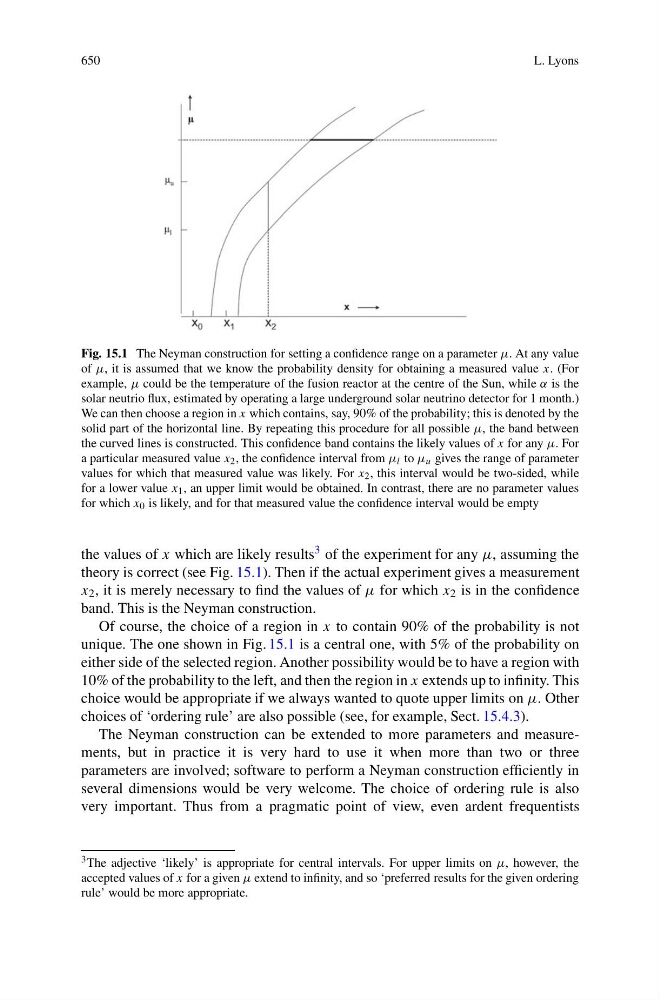
Fig. 15.1 The Neyman construction for setting a confidence range on a parameter μ. At any value
of μ, it is assumed that we know the probability density for obtaining a measured value x. (For
example, μ could be the temperature of the fusion reactor at the centre of the Sun, while α is the
solar neutrio flux, estimated by operating a large underground solar neutrino detector for 1 month.)
We can then choose a region in x which contains, say, 90% of the probability; this is denoted by the
solid part of the horizontal line. By repeating this procedure for all possible μ, the band between
the curved lines is constructed. This confidence band contains the likely values of x for any μ. For
a particular measured value x 2 , the confidence interval from μ l to μ u gives the range of parameter
values for which that measured value was likely. For x 2 , this interval would be two-sided, while
for a lower value x 1 , an upper limit would be obtained. In contrast, there are no parameter values
for which x 0 is likely, and for that measured value the confidence interval would be empty
the values of x which are likely results 3 of the experiment for any μ, assuming the
theory is correct (see Fig. 15.1). Then if the actual experiment gives a measurement
x 2 , it is merely necessary to find the values of μ for which x 2 is in the confidence
band. This is the Neyman construction.
Of course, the choice of a region in x to contain 90% of the probability is not
unique. The one shown in Fig. 15.1 is a central one, with 5% of the probability on
either side of the selected region. Another possibility would be to have a region with
10% of the probability to the left, and then the region in x extends up to infinity. This
choice would be appropriate if we always wanted to quote upper limits on μ. Other
choices of ‘ordering rule’ are also possible (see, for example, Sect. 15.4.3).
The Neyman construction can be extended to more parameters and measurements, but in practice it is very hard to use it when more than two or three
parameters are involved; software to perform a Neyman construction efficiently in
several dimensions would be very welcome. The choice of ordering rule is also
very important. Thus from a pragmatic point of view, even ardent frequentists
3 The adjective ‘likely’ is appropriate for central intervals. For upper limits on μ, however, the
accepted values of x for a given μ extend to infinity, and so ‘preferred results for the given ordering
rule’ would be more appropriate.