

550
M. Lamont et al.
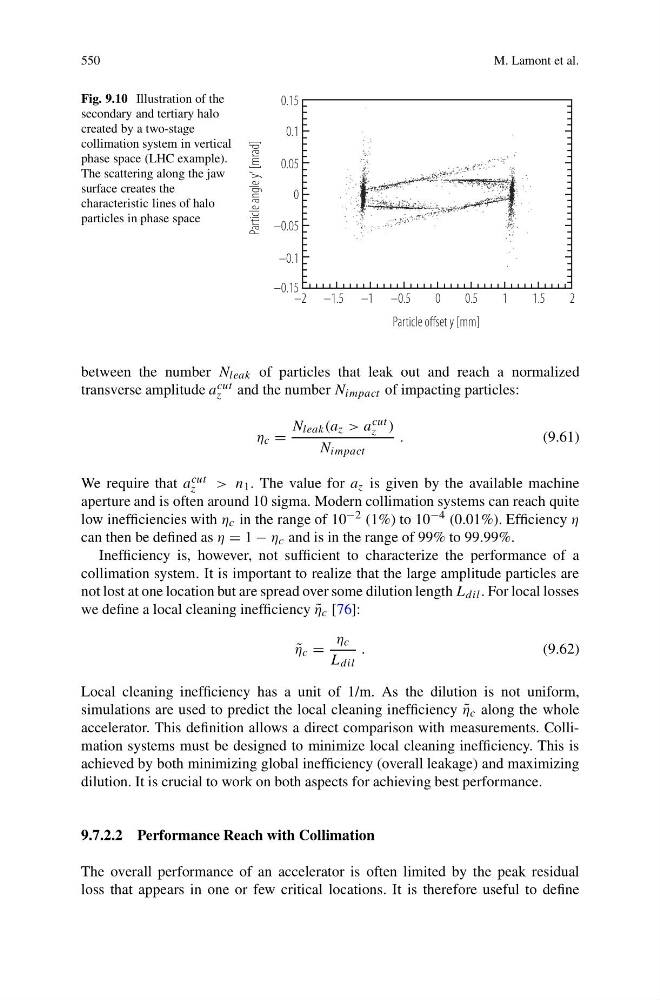
Fig. 9.10 Illustration of the
secondary and tertiary halo
created by a two-stage
collimation system in vertical
phase space (LHC example).
The scattering along the jaw
surface creates the
characteristic lines of halo
particles in phase space
Particle angle y‘ [mrad]
–0.05
–0.1
–0.15
0.15
0.1
0.05
0
5
.
0
–
0
5
.
0
1
5
.
1
2
Particle offset y [mm]
2
–
5
.
1
–
1
–
between the number N leak of particles that leak out and reach a normalized
transverse amplitude a cut
z and the number N impact of impacting particles:
η c =
N leak (a z > a cut
z )
N impact
.
(9.61)
We require that a cut
z
> n 1 . The value for a z is given by the available machine
aperture and is often around 10 sigma. Modern collimation systems can reach quite
low inefficiencies with η c in the range of 10 −2 (1%) to 10 −4 (0.01%). Efficiency η
can then be defined as η = 1 − η c and is in the range of 99% to 99.99%.
Inefficiency is, however, not sufficient to characterize the performance of a
collimation system. It is important to realize that the large amplitude particles are
not lost at one location but are spread over some dilution length L dil . For local losses
we define a local cleaning inefficiency ˜
η c [76]:
˜
η c =
η c
L dil
.
(9.62)
Local cleaning inefficiency has a unit of 1/m. As the dilution is not uniform,
simulations are used to predict the local cleaning inefficiency ˜
η c along the whole
accelerator. This definition allows a direct comparison with measurements. Collimation systems must be designed to minimize local cleaning inefficiency. This is
achieved by both minimizing global inefficiency (overall leakage) and maximizing
dilution. It is crucial to work on both aspects for achieving best performance.
9.7.2.2 Performance Reach with Collimation
The overall performance of an accelerator is often limited by the peak residual
loss that appears in one or few critical locations. It is therefore useful to define
M. Lamont et al.
Fig. 9.10 Illustration of the
secondary and tertiary halo
created by a two-stage
collimation system in vertical
phase space (LHC example).
The scattering along the jaw
surface creates the
characteristic lines of halo
particles in phase space
Particle angle y‘ [mrad]
–0.05
–0.1
–0.15
0.15
0.1
0.05
0
5
.
0
–
0
5
.
0
1
5
.
1
2
Particle offset y [mm]
2
–
5
.
1
–
1
–
between the number N leak of particles that leak out and reach a normalized
transverse amplitude a cut
z and the number N impact of impacting particles:
η c =
N leak (a z > a cut
z )
N impact
.
(9.61)
We require that a cut
z
> n 1 . The value for a z is given by the available machine
aperture and is often around 10 sigma. Modern collimation systems can reach quite
low inefficiencies with η c in the range of 10 −2 (1%) to 10 −4 (0.01%). Efficiency η
can then be defined as η = 1 − η c and is in the range of 99% to 99.99%.
Inefficiency is, however, not sufficient to characterize the performance of a
collimation system. It is important to realize that the large amplitude particles are
not lost at one location but are spread over some dilution length L dil . For local losses
we define a local cleaning inefficiency ˜
η c [76]:
˜
η c =
η c
L dil
.
(9.62)
Local cleaning inefficiency has a unit of 1/m. As the dilution is not uniform,
simulations are used to predict the local cleaning inefficiency ˜
η c along the whole
accelerator. This definition allows a direct comparison with measurements. Collimation systems must be designed to minimize local cleaning inefficiency. This is
achieved by both minimizing global inefficiency (overall leakage) and maximizing
dilution. It is crucial to work on both aspects for achieving best performance.
9.7.2.2 Performance Reach with Collimation
The overall performance of an accelerator is often limited by the peak residual
loss that appears in one or few critical locations. It is therefore useful to define