

26
2 Summary Tables
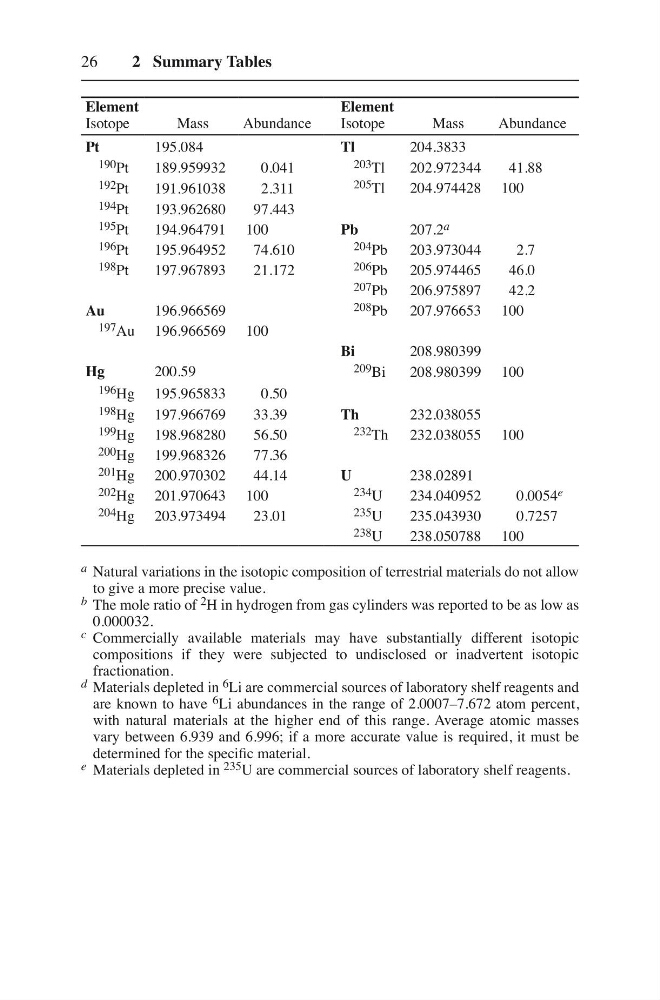
Element
Isotope
Mass
Abundance
Element
Isotope
Mass
Abundance
Pt
195.084
Tl
204.3833
190 Pt
189.959932
0.041
203 Tl
202.972344
41.88
192 Pt
191.961038
2.311
205 Tl
204.974428 100
194 Pt
193.962680
97.443
195 Pt
194.964791 100
Pb
207.2 a
196 Pt
195.964952
74.610
204 Pb 203.973044
2.7
198 Pt
197.967893
21.172
206 Pb 205.974465
46.0
207 Pb 206.975897
42.2
Au
196.966569
208 Pb 207.976653 100
197 Au 196.966569 100
Bi
208.980399
Hg
200.59
209 Bi
208.980399 100
196 Hg 195.965833
0.50
198 Hg 197.966769
33.39
Th
232.038055
199 Hg 198.968280
56.50
232 Th 232.038055 100
200 Hg 199.968326
77.36
201 Hg 200.970302
44.14
U
238.02891
202 Hg 201.970643 100
234 U
234.040952
0.0054 e
204 Hg 203.973494
23.01
235 U
235.043930
0.7257
238 U
238.050788 100
a Natural variations in the isotopic composition of terrestrial materials do not allow
to give a more precise value.
b The mole ratio of 2 H in hydrogen from gas cylinders was reported to be as low as
0.000032.
c Commercially available materials may have substantially different isotopic
compositions if they were subjected to undisclosed or inadvertent isotopic
fractionation.
d Materials depleted in 6 Li are commercial sources of laboratory shelf reagents and
are known to have 6 Li abundances in the range of 2.0007–7.672 atom percent,
with natural materials at the higher end of this range. Average atomic masses
vary between 6.939 and 6.996; if a more accurate value is required, it must be
determined for the specific material.
e Materials depleted in 235 U are commercial sources of laboratory shelf reagents.
2 Summary Tables
Element
Isotope
Mass
Abundance
Element
Isotope
Mass
Abundance
Pt
195.084
Tl
204.3833
190 Pt
189.959932
0.041
203 Tl
202.972344
41.88
192 Pt
191.961038
2.311
205 Tl
204.974428 100
194 Pt
193.962680
97.443
195 Pt
194.964791 100
Pb
207.2 a
196 Pt
195.964952
74.610
204 Pb 203.973044
2.7
198 Pt
197.967893
21.172
206 Pb 205.974465
46.0
207 Pb 206.975897
42.2
Au
196.966569
208 Pb 207.976653 100
197 Au 196.966569 100
Bi
208.980399
Hg
200.59
209 Bi
208.980399 100
196 Hg 195.965833
0.50
198 Hg 197.966769
33.39
Th
232.038055
199 Hg 198.968280
56.50
232 Th 232.038055 100
200 Hg 199.968326
77.36
201 Hg 200.970302
44.14
U
238.02891
202 Hg 201.970643 100
234 U
234.040952
0.0054 e
204 Hg 203.973494
23.01
235 U
235.043930
0.7257
238 U
238.050788 100
a Natural variations in the isotopic composition of terrestrial materials do not allow
to give a more precise value.
b The mole ratio of 2 H in hydrogen from gas cylinders was reported to be as low as
0.000032.
c Commercially available materials may have substantially different isotopic
compositions if they were subjected to undisclosed or inadvertent isotopic
fractionation.
d Materials depleted in 6 Li are commercial sources of laboratory shelf reagents and
are known to have 6 Li abundances in the range of 2.0007–7.672 atom percent,
with natural materials at the higher end of this range. Average atomic masses
vary between 6.939 and 6.996; if a more accurate value is required, it must be
determined for the specific material.
e Materials depleted in 235 U are commercial sources of laboratory shelf reagents.