

To evaluate changes in world trade, a macro level model of global supply chains
was used, in the form of a Spatial Computable General Equilibrium (SCGE) model
of the global economy. The SCGE model EXIOMOD (Ivanova 2014) was linked to
a network model (Tavasszy et al. 2011) to understand changes in the global routing
of transport flows. The internalization scenario produced a new global economic
equilibrium for production, consumption and trade, and the network assignment
showed how these new trade flows would affect main maritime ports in the network,
such as the port of Rotterdam. Table 2.2 summarizes the results of the calculations
for the Netherlands.
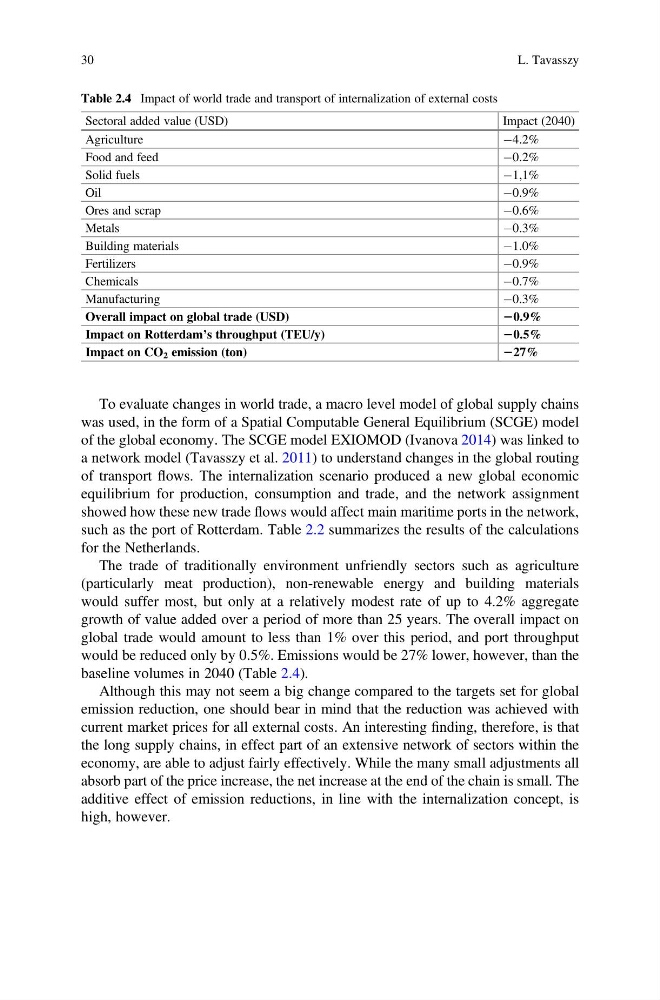
The trade of traditionally environment unfriendly sectors such as agriculture
(particularly meat production), non-renewable energy and building materials
would suffer most, but only at a relatively modest rate of up to 4.2% aggregate
growth of value added over a period of more than 25 years. The overall impact on
global trade would amount to less than 1% over this period, and port throughput
would be reduced only by 0.5%. Emissions would be 27% lower, however, than the
baseline volumes in 2040 (Table 2.4).
Although this may not seem a big change compared to the targets set for global
emission reduction, one should bear in mind that the reduction was achieved with
current market prices for all external costs. An interesting finding, therefore, is that
the long supply chains, in effect part of an extensive network of sectors within the
economy, are able to adjust fairly effectively. While the many small adjustments all
absorb part of the price increase, the net increase at the end of the chain is small. The
additive effect of emission reductions, in line with the internalization concept, is
high, however.
Table 2.4 Impact of world trade and transport of internalization of external costs
Sectoral added value (USD)
Impact (2040)
Agriculture
À4.2%
Food and feed
À0.2%
Solid fuels
À1,1%
Oil
À0.9%
Ores and scrap
À0.6%
Metals
À0.3%
Building materials
À1.0%
Fertilizers
À0.9%
Chemicals
À0.7%
Manufacturing
À0.3%
Overall impact on global trade (USD)
20.9%
Impact on Rotterdam’s throughput (TEU/y)
20.5%
Impact on CO 2 emission (ton)
227%
30
L. Tavasszy
was used, in the form of a Spatial Computable General Equilibrium (SCGE) model
of the global economy. The SCGE model EXIOMOD (Ivanova 2014) was linked to
a network model (Tavasszy et al. 2011) to understand changes in the global routing
of transport flows. The internalization scenario produced a new global economic
equilibrium for production, consumption and trade, and the network assignment
showed how these new trade flows would affect main maritime ports in the network,
such as the port of Rotterdam. Table 2.2 summarizes the results of the calculations
for the Netherlands.
The trade of traditionally environment unfriendly sectors such as agriculture
(particularly meat production), non-renewable energy and building materials
would suffer most, but only at a relatively modest rate of up to 4.2% aggregate
growth of value added over a period of more than 25 years. The overall impact on
global trade would amount to less than 1% over this period, and port throughput
would be reduced only by 0.5%. Emissions would be 27% lower, however, than the
baseline volumes in 2040 (Table 2.4).
Although this may not seem a big change compared to the targets set for global
emission reduction, one should bear in mind that the reduction was achieved with
current market prices for all external costs. An interesting finding, therefore, is that
the long supply chains, in effect part of an extensive network of sectors within the
economy, are able to adjust fairly effectively. While the many small adjustments all
absorb part of the price increase, the net increase at the end of the chain is small. The
additive effect of emission reductions, in line with the internalization concept, is
high, however.
Table 2.4 Impact of world trade and transport of internalization of external costs
Sectoral added value (USD)
Impact (2040)
Agriculture
À4.2%
Food and feed
À0.2%
Solid fuels
À1,1%
Oil
À0.9%
Ores and scrap
À0.6%
Metals
À0.3%
Building materials
À1.0%
Fertilizers
À0.9%
Chemicals
À0.7%
Manufacturing
À0.3%
Overall impact on global trade (USD)
20.9%
Impact on Rotterdam’s throughput (TEU/y)
20.5%
Impact on CO 2 emission (ton)
227%
30
L. Tavasszy