

180
6 Thermo-Responsive Phosphorescence Control Mediated …
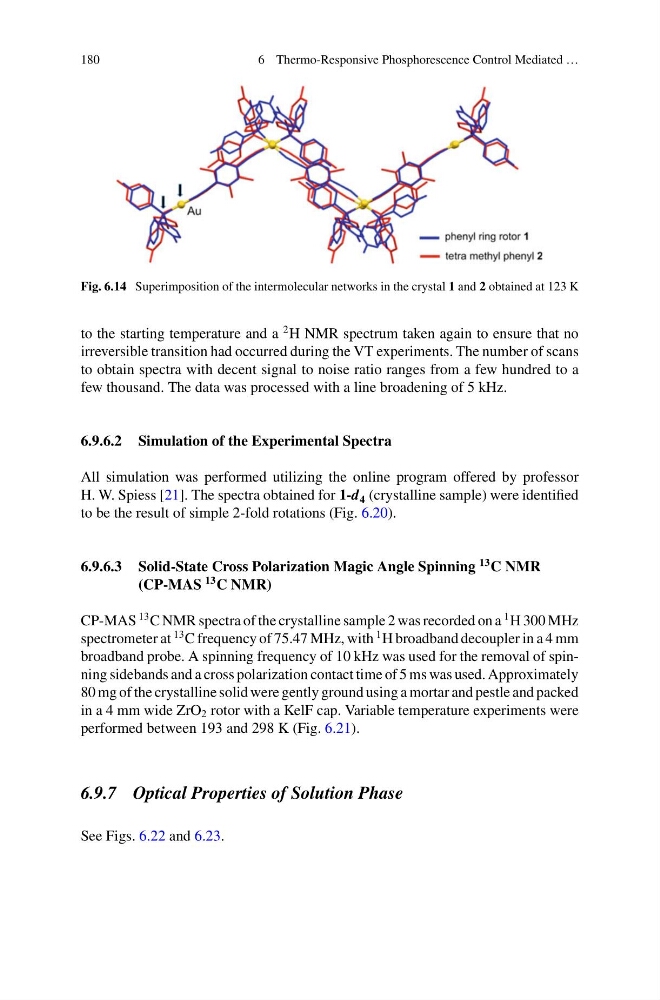
Fig. 6.14 Superimposition of the intermolecular networks in the crystal 1 and 2 obtained at 123 K
to the starting temperature and a
2 H NMR spectrum taken again to ensure that no
irreversible transition had occurred during the VT experiments. The number of scans
to obtain spectra with decent signal to noise ratio ranges from a few hundred to a
few thousand. The data was processed with a line broadening of 5 kHz.
6.9.6.2 Simulation of the Experimental Spectra
All simulation was performed utilizing the online program offered by professor
H. W. Spiess [21]. The spectra obtained for 1-d 4 (crystalline sample) were identified
to be the result of simple 2-fold rotations (Fig. 6.20).
6.9.6.3 Solid-State Cross Polarization Magic Angle Spinning
13 C NMR
(CP-MAS
13 C NMR)
CP-MAS
13 C NMR spectra of the crystalline sample 2 was recorded on a
1 H 300 MHz
spectrometer at
13 C frequency of 75.47 MHz, with
1 H broadband decoupler in a 4 mm
broadband probe. A spinning frequency of 10 kHz was used for the removal of spinning sidebands and a cross polarization contact time of 5 ms was used. Approximately
80 mg of the crystalline solid were gently ground using a mortar and pestle and packed
in a 4 mm wide ZrO 2 rotor with a KelF cap. Variable temperature experiments were
performed between 193 and 298 K (Fig. 6.21).
6.9.7 Optical Properties of Solution Phase
See Figs. 6.22 and 6.23.
6 Thermo-Responsive Phosphorescence Control Mediated …
Fig. 6.14 Superimposition of the intermolecular networks in the crystal 1 and 2 obtained at 123 K
to the starting temperature and a
2 H NMR spectrum taken again to ensure that no
irreversible transition had occurred during the VT experiments. The number of scans
to obtain spectra with decent signal to noise ratio ranges from a few hundred to a
few thousand. The data was processed with a line broadening of 5 kHz.
6.9.6.2 Simulation of the Experimental Spectra
All simulation was performed utilizing the online program offered by professor
H. W. Spiess [21]. The spectra obtained for 1-d 4 (crystalline sample) were identified
to be the result of simple 2-fold rotations (Fig. 6.20).
6.9.6.3 Solid-State Cross Polarization Magic Angle Spinning
13 C NMR
(CP-MAS
13 C NMR)
CP-MAS
13 C NMR spectra of the crystalline sample 2 was recorded on a
1 H 300 MHz
spectrometer at
13 C frequency of 75.47 MHz, with
1 H broadband decoupler in a 4 mm
broadband probe. A spinning frequency of 10 kHz was used for the removal of spinning sidebands and a cross polarization contact time of 5 ms was used. Approximately
80 mg of the crystalline solid were gently ground using a mortar and pestle and packed
in a 4 mm wide ZrO 2 rotor with a KelF cap. Variable temperature experiments were
performed between 193 and 298 K (Fig. 6.21).
6.9.7 Optical Properties of Solution Phase
See Figs. 6.22 and 6.23.