

6.9 Experimental Section
177
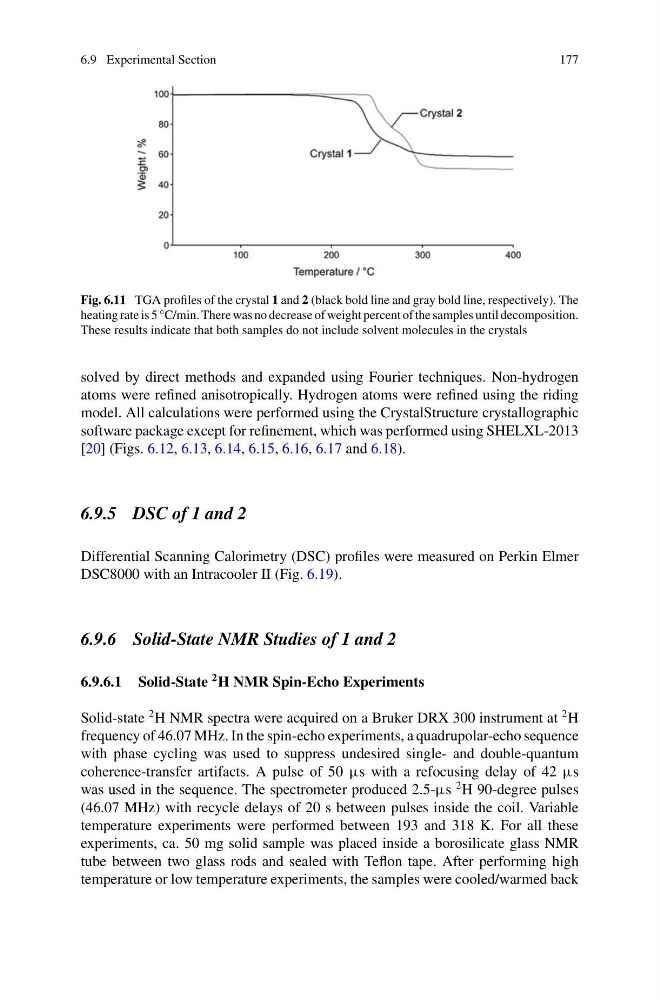
Fig. 6.11 TGA profiles of the crystal 1 and 2 (black bold line and gray bold line, respectively). The
heating rate is 5 °C/min. There was no decrease of weight percent of the samples until decomposition.
These results indicate that both samples do not include solvent molecules in the crystals
solved by direct methods and expanded using Fourier techniques. Non-hydrogen
atoms were refined anisotropically. Hydrogen atoms were refined using the riding
model. All calculations were performed using the CrystalStructure crystallographic
software package except for refinement, which was performed using SHELXL-2013
[20] (Figs. 6.12, 6.13, 6.14, 6.15, 6.16, 6.17 and 6.18).
6.9.5 DSC of 1 and 2
Differential Scanning Calorimetry (DSC) profiles were measured on Perkin Elmer
DSC8000 with an Intracooler II (Fig. 6.19).
6.9.6 Solid-State NMR Studies of 1 and 2
6.9.6.1 Solid-State
2 H NMR Spin-Echo Experiments
Solid-state
2 H NMR spectra were acquired on a Bruker DRX 300 instrument at
2 H
frequency of 46.07 MHz. In the spin-echo experiments, a quadrupolar-echo sequence
with phase cycling was used to suppress undesired single- and double-quantum
coherence-transfer artifacts. A pulse of 50 μs with a refocusing delay of 42 μs
was used in the sequence. The spectrometer produced 2.5-μs
2 H 90-degree pulses
(46.07 MHz) with recycle delays of 20 s between pulses inside the coil. Variable
temperature experiments were performed between 193 and 318 K. For all these
experiments, ca. 50 mg solid sample was placed inside a borosilicate glass NMR
tube between two glass rods and sealed with Teflon tape. After performing high
temperature or low temperature experiments, the samples were cooled/warmed back
177
Fig. 6.11 TGA profiles of the crystal 1 and 2 (black bold line and gray bold line, respectively). The
heating rate is 5 °C/min. There was no decrease of weight percent of the samples until decomposition.
These results indicate that both samples do not include solvent molecules in the crystals
solved by direct methods and expanded using Fourier techniques. Non-hydrogen
atoms were refined anisotropically. Hydrogen atoms were refined using the riding
model. All calculations were performed using the CrystalStructure crystallographic
software package except for refinement, which was performed using SHELXL-2013
[20] (Figs. 6.12, 6.13, 6.14, 6.15, 6.16, 6.17 and 6.18).
6.9.5 DSC of 1 and 2
Differential Scanning Calorimetry (DSC) profiles were measured on Perkin Elmer
DSC8000 with an Intracooler II (Fig. 6.19).
6.9.6 Solid-State NMR Studies of 1 and 2
6.9.6.1 Solid-State
2 H NMR Spin-Echo Experiments
Solid-state
2 H NMR spectra were acquired on a Bruker DRX 300 instrument at
2 H
frequency of 46.07 MHz. In the spin-echo experiments, a quadrupolar-echo sequence
with phase cycling was used to suppress undesired single- and double-quantum
coherence-transfer artifacts. A pulse of 50 μs with a refocusing delay of 42 μs
was used in the sequence. The spectrometer produced 2.5-μs
2 H 90-degree pulses
(46.07 MHz) with recycle delays of 20 s between pulses inside the coil. Variable
temperature experiments were performed between 193 and 318 K. For all these
experiments, ca. 50 mg solid sample was placed inside a borosilicate glass NMR
tube between two glass rods and sealed with Teflon tape. After performing high
temperature or low temperature experiments, the samples were cooled/warmed back