

3.7 Experimental Section
97
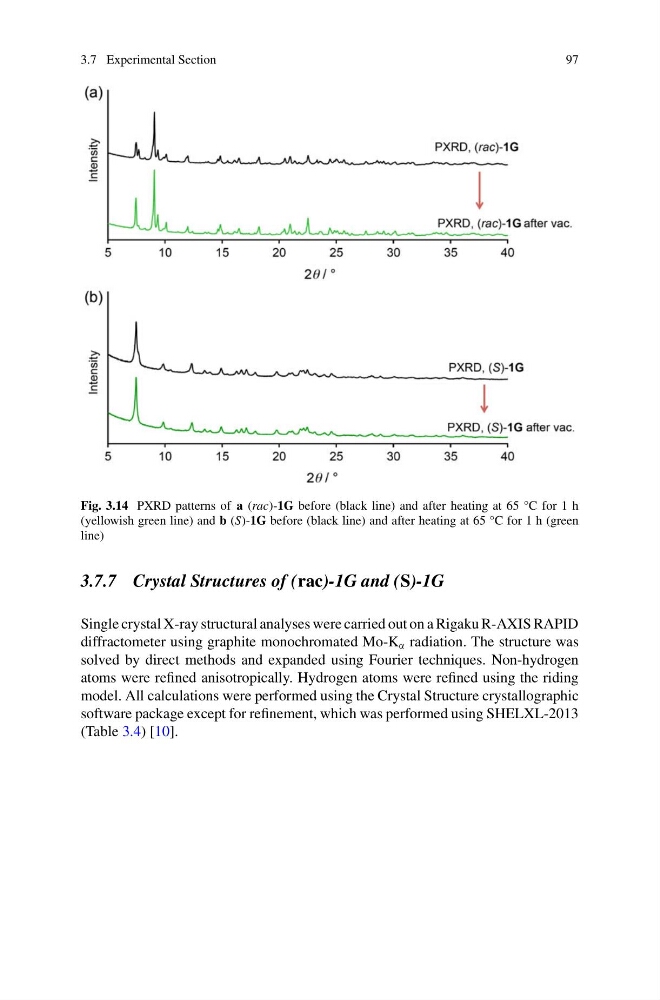
Fig. 3.14 PXRD patterns of a (rac)-1G before (black line) and after heating at 65 °C for 1 h
(yellowish green line) and b (S)-1G before (black line) and after heating at 65 °C for 1 h (green
line)
3.7.7 Crystal Structures of (rac)-1G and (S)-1G
Single crystal X-ray structural analyses were carried out on a Rigaku R-AXIS RAPID
diffractometer using graphite monochromated Mo-K α radiation. The structure was
solved by direct methods and expanded using Fourier techniques. Non-hydrogen
atoms were refined anisotropically. Hydrogen atoms were refined using the riding
model. All calculations were performed using the Crystal Structure crystallographic
software package except for refinement, which was performed using SHELXL-2013
(Table 3.4) [10].
97
Fig. 3.14 PXRD patterns of a (rac)-1G before (black line) and after heating at 65 °C for 1 h
(yellowish green line) and b (S)-1G before (black line) and after heating at 65 °C for 1 h (green
line)
3.7.7 Crystal Structures of (rac)-1G and (S)-1G
Single crystal X-ray structural analyses were carried out on a Rigaku R-AXIS RAPID
diffractometer using graphite monochromated Mo-K α radiation. The structure was
solved by direct methods and expanded using Fourier techniques. Non-hydrogen
atoms were refined anisotropically. Hydrogen atoms were refined using the riding
model. All calculations were performed using the Crystal Structure crystallographic
software package except for refinement, which was performed using SHELXL-2013
(Table 3.4) [10].