

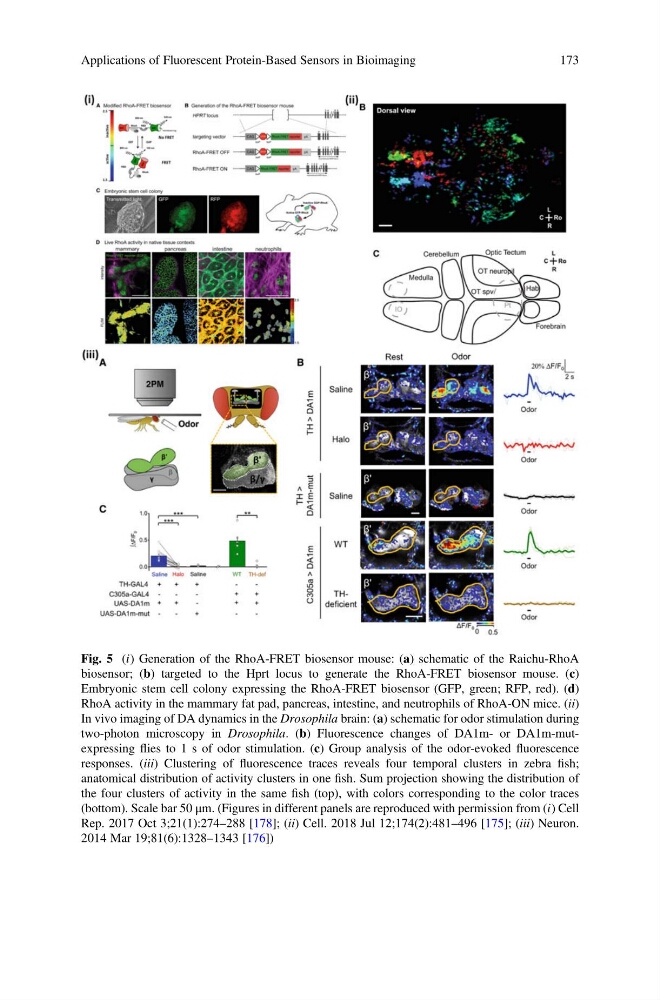
Fig. 5 (i) Generation of the RhoA-FRET biosensor mouse: (a) schematic of the Raichu-RhoA
biosensor; (b) targeted to the Hprt locus to generate the RhoA-FRET biosensor mouse. (c)
Embryonic stem cell colony expressing the RhoA-FRET biosensor (GFP, green; RFP, red). (d)
RhoA activity in the mammary fat pad, pancreas, intestine, and neutrophils of RhoA-ON mice. (ii)
In vivo imaging of DA dynamics in the Drosophila brain: (a) schematic for odor stimulation during
two-photon microscopy in Drosophila. (b) Fluorescence changes of DA1m- or DA1m-mutexpressing flies to 1 s of odor stimulation. (c) Group analysis of the odor-evoked fluorescence
responses. (iii) Clustering of fluorescence traces reveals four temporal clusters in zebra fish;
anatomical distribution of activity clusters in one fish. Sum projection showing the distribution of
the four clusters of activity in the same fish (top), with colors corresponding to the color traces
(bottom). Scale bar 50 μm. (Figures in different panels are reproduced with permission from (i) Cell
Rep. 2017 Oct 3;21(1):274–288 [178]; (ii) Cell. 2018 Jul 12;174(2):481–496 [175]; (iii) Neuron.
2014 Mar 19;81(6):1328–1343 [176])
Applications of Fluorescent Protein-Based Sensors in Bioimaging
173
biosensor; (b) targeted to the Hprt locus to generate the RhoA-FRET biosensor mouse. (c)
Embryonic stem cell colony expressing the RhoA-FRET biosensor (GFP, green; RFP, red). (d)
RhoA activity in the mammary fat pad, pancreas, intestine, and neutrophils of RhoA-ON mice. (ii)
In vivo imaging of DA dynamics in the Drosophila brain: (a) schematic for odor stimulation during
two-photon microscopy in Drosophila. (b) Fluorescence changes of DA1m- or DA1m-mutexpressing flies to 1 s of odor stimulation. (c) Group analysis of the odor-evoked fluorescence
responses. (iii) Clustering of fluorescence traces reveals four temporal clusters in zebra fish;
anatomical distribution of activity clusters in one fish. Sum projection showing the distribution of
the four clusters of activity in the same fish (top), with colors corresponding to the color traces
(bottom). Scale bar 50 μm. (Figures in different panels are reproduced with permission from (i) Cell
Rep. 2017 Oct 3;21(1):274–288 [178]; (ii) Cell. 2018 Jul 12;174(2):481–496 [175]; (iii) Neuron.
2014 Mar 19;81(6):1328–1343 [176])
Applications of Fluorescent Protein-Based Sensors in Bioimaging
173