

Fig. 18
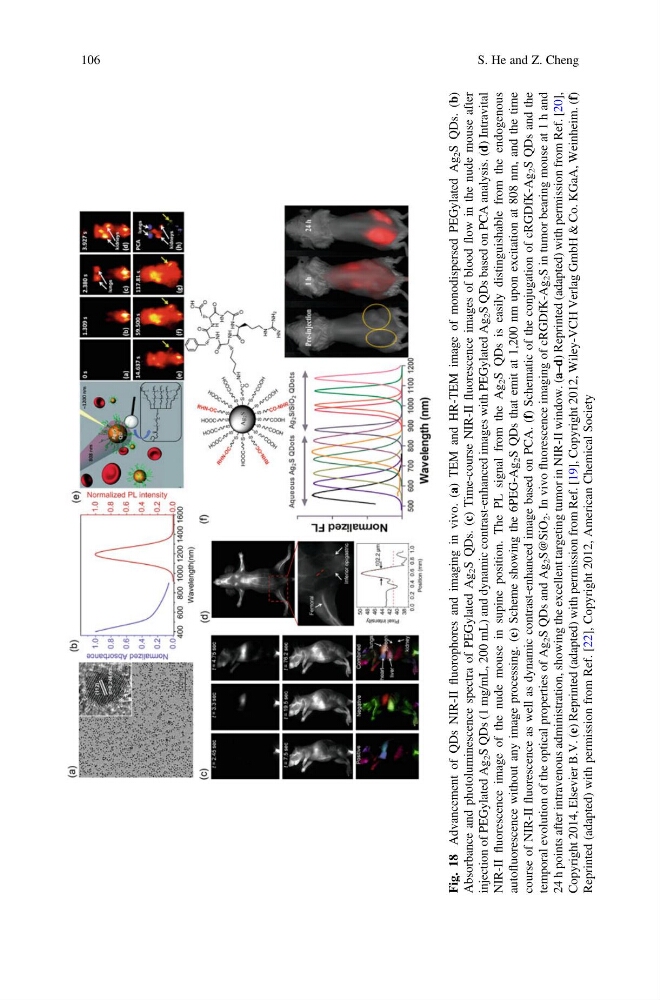
Advancement of QDs NIR-II
fluorophores and imaging in vivo. (a) TEM and HR-TEM image of monodispersed PEGylated Ag
2 S QDs. (b)
Absorbance and photoluminescence spectra of PEGylated Ag
2 S QDs. (c) Time-course NIR-II
fluorescence images of blood
flow in the nude mouse after
injection of PEGylated Ag
2 S QDs (1 mg/mL, 200 mL) and dynamic contrast-enhanced images with PEGylated Ag
2 S QDs based on PCA analysis. (d) Intravital
NIR-II
fluorescence image of the nude mouse in supine position. The PL signal from the Ag
2 S QDs is easily distinguishable from the endogenous
autofluorescence without any image processing. (e) Scheme showing the 6PEG-Ag
2 S QDs that emit at 1,200 nm upon excitation at 808 nm, and the time
course of NIR-II
fluorescence as well as dynamic contrast-enhanced image based on PCA. (f) Schematic of the conjugation of cRGDfK-Ag
2 S QDs and the
temporal evolution of the optical properties of Ag
2 S QDs and Ag
2 S@SiO
2 . In vivo
fluorescence imaging of cRGDfK-Ag
2 S in tumor bearing mouse at 1 h and
24 h points after intravenous administration, showing the excellent targeting tumor in NIR-II window. (a–d) Reprinted (adapted) with permission from Ref. [20],
Copyright 2014, Elsevier B.V. (e) Reprinted (adapted) with permission from Ref. [19], Copyright 2012, Wiley-VCH Verlag GmbH & Co. KGaA, Weinheim. (f)
Reprinted (adapted) with permission from Ref. [22], Copyright 2012, American Chemical Society
106
S. He and Z. Cheng
Advancement of QDs NIR-II
fluorophores and imaging in vivo. (a) TEM and HR-TEM image of monodispersed PEGylated Ag
2 S QDs. (b)
Absorbance and photoluminescence spectra of PEGylated Ag
2 S QDs. (c) Time-course NIR-II
fluorescence images of blood
flow in the nude mouse after
injection of PEGylated Ag
2 S QDs (1 mg/mL, 200 mL) and dynamic contrast-enhanced images with PEGylated Ag
2 S QDs based on PCA analysis. (d) Intravital
NIR-II
fluorescence image of the nude mouse in supine position. The PL signal from the Ag
2 S QDs is easily distinguishable from the endogenous
autofluorescence without any image processing. (e) Scheme showing the 6PEG-Ag
2 S QDs that emit at 1,200 nm upon excitation at 808 nm, and the time
course of NIR-II
fluorescence as well as dynamic contrast-enhanced image based on PCA. (f) Schematic of the conjugation of cRGDfK-Ag
2 S QDs and the
temporal evolution of the optical properties of Ag
2 S QDs and Ag
2 S@SiO
2 . In vivo
fluorescence imaging of cRGDfK-Ag
2 S in tumor bearing mouse at 1 h and
24 h points after intravenous administration, showing the excellent targeting tumor in NIR-II window. (a–d) Reprinted (adapted) with permission from Ref. [20],
Copyright 2014, Elsevier B.V. (e) Reprinted (adapted) with permission from Ref. [19], Copyright 2012, Wiley-VCH Verlag GmbH & Co. KGaA, Weinheim. (f)
Reprinted (adapted) with permission from Ref. [22], Copyright 2012, American Chemical Society
106
S. He and Z. Cheng