

not seem to have made an attempt on the identification of hyper-arid areas in the Indian Desert.
17.3 Demarcation Bases of HyperArid Land
The present demarcation of hyper-arid zone in
the Indian Desert is largely based on the latest
criterion of climatic classification by Kafle and
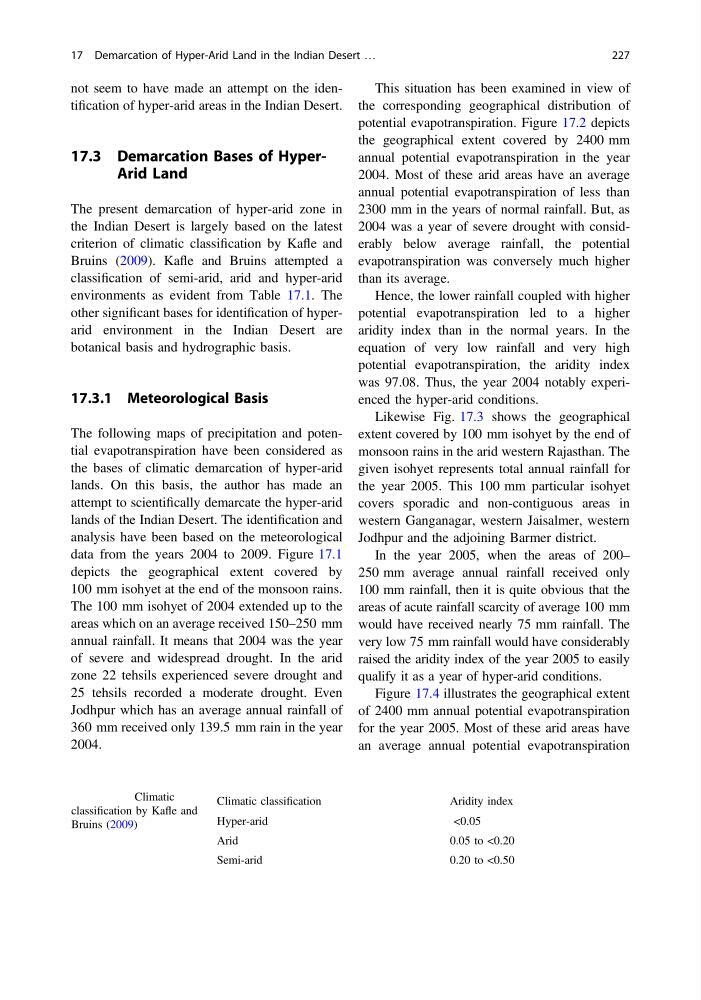
Bruins (2009). Kafle and Bruins attempted a
classification of semi-arid, arid and hyper-arid
environments as evident from Table 17.1. The
other significant bases for identification of hyperarid environment in the Indian Desert are
botanical basis and hydrographic basis.
17.3.1 Meteorological Basis
The following maps of precipitation and potential evapotranspiration have been considered as
the bases of climatic demarcation of hyper-arid
lands. On this basis, the author has made an
attempt to scientifically demarcate the hyper-arid
lands of the Indian Desert. The identification and
analysis have been based on the meteorological
data from the years 2004 to 2009. Figure 17.1
depicts the geographical extent covered by
100 mm isohyet at the end of the monsoon rains.
The 100 mm isohyet of 2004 extended up to the
areas which on an average received 150–250 mm
annual rainfall. It means that 2004 was the year
of severe and widespread drought. In the arid
zone 22 tehsils experienced severe drought and
25 tehsils recorded a moderate drought. Even
Jodhpur which has an average annual rainfall of
360 mm received only 139.5 mm rain in the year
2004.
This situation has been examined in view of
the corresponding geographical distribution of
potential evapotranspiration. Figure 17.2 depicts
the geographical extent covered by 2400 mm
annual potential evapotranspiration in the year
2004. Most of these arid areas have an average
annual potential evapotranspiration of less than
2300 mm in the years of normal rainfall. But, as
2004 was a year of severe drought with considerably below average rainfall, the potential
evapotranspiration was conversely much higher
than its average.
Hence, the lower rainfall coupled with higher
potential evapotranspiration led to a higher
aridity index than in the normal years. In the
equation of very low rainfall and very high
potential evapotranspiration, the aridity index
was 97.08. Thus, the year 2004 notably experienced the hyper-arid conditions.
Likewise Fig. 17.3 shows the geographical
extent covered by 100 mm isohyet by the end of
monsoon rains in the arid western Rajasthan. The
given isohyet represents total annual rainfall for
the year 2005. This 100 mm particular isohyet
covers sporadic and non-contiguous areas in
western Ganganagar, western Jaisalmer, western
Jodhpur and the adjoining Barmer district.
In the year 2005, when the areas of 200–
250 mm average annual rainfall received only
100 mm rainfall, then it is quite obvious that the
areas of acute rainfall scarcity of average 100 mm
would have received nearly 75 mm rainfall. The
very low 75 mm rainfall would have considerably
raised the aridity index of the year 2005 to easily
qualify it as a year of hyper-arid conditions.
Figure 17.4 illustrates the geographical extent
of 2400 mm annual potential evapotranspiration
for the year 2005. Most of these arid areas have
an average annual potential evapotranspiration
Table 17.1 Climatic
classification by Kafle and
Bruins (2009)
Climatic classification
Aridity index
Hyper-arid
<0.05
Arid
0.05 to <0.20
Semi-arid
0.20 to <0.50
17 Demarcation of Hyper-Arid Land in the Indian Desert …
227
17.3 Demarcation Bases of HyperArid Land
The present demarcation of hyper-arid zone in
the Indian Desert is largely based on the latest
criterion of climatic classification by Kafle and
Bruins (2009). Kafle and Bruins attempted a
classification of semi-arid, arid and hyper-arid
environments as evident from Table 17.1. The
other significant bases for identification of hyperarid environment in the Indian Desert are
botanical basis and hydrographic basis.
17.3.1 Meteorological Basis
The following maps of precipitation and potential evapotranspiration have been considered as
the bases of climatic demarcation of hyper-arid
lands. On this basis, the author has made an
attempt to scientifically demarcate the hyper-arid
lands of the Indian Desert. The identification and
analysis have been based on the meteorological
data from the years 2004 to 2009. Figure 17.1
depicts the geographical extent covered by
100 mm isohyet at the end of the monsoon rains.
The 100 mm isohyet of 2004 extended up to the
areas which on an average received 150–250 mm
annual rainfall. It means that 2004 was the year
of severe and widespread drought. In the arid
zone 22 tehsils experienced severe drought and
25 tehsils recorded a moderate drought. Even
Jodhpur which has an average annual rainfall of
360 mm received only 139.5 mm rain in the year
2004.
This situation has been examined in view of
the corresponding geographical distribution of
potential evapotranspiration. Figure 17.2 depicts
the geographical extent covered by 2400 mm
annual potential evapotranspiration in the year
2004. Most of these arid areas have an average
annual potential evapotranspiration of less than
2300 mm in the years of normal rainfall. But, as
2004 was a year of severe drought with considerably below average rainfall, the potential
evapotranspiration was conversely much higher
than its average.
Hence, the lower rainfall coupled with higher
potential evapotranspiration led to a higher
aridity index than in the normal years. In the
equation of very low rainfall and very high
potential evapotranspiration, the aridity index
was 97.08. Thus, the year 2004 notably experienced the hyper-arid conditions.
Likewise Fig. 17.3 shows the geographical
extent covered by 100 mm isohyet by the end of
monsoon rains in the arid western Rajasthan. The
given isohyet represents total annual rainfall for
the year 2005. This 100 mm particular isohyet
covers sporadic and non-contiguous areas in
western Ganganagar, western Jaisalmer, western
Jodhpur and the adjoining Barmer district.
In the year 2005, when the areas of 200–
250 mm average annual rainfall received only
100 mm rainfall, then it is quite obvious that the
areas of acute rainfall scarcity of average 100 mm
would have received nearly 75 mm rainfall. The
very low 75 mm rainfall would have considerably
raised the aridity index of the year 2005 to easily
qualify it as a year of hyper-arid conditions.
Figure 17.4 illustrates the geographical extent
of 2400 mm annual potential evapotranspiration
for the year 2005. Most of these arid areas have
an average annual potential evapotranspiration
Table 17.1 Climatic
classification by Kafle and
Bruins (2009)
Climatic classification
Aridity index
Hyper-arid
<0.05
Arid
0.05 to <0.20
Semi-arid
0.20 to <0.50
17 Demarcation of Hyper-Arid Land in the Indian Desert …
227