

mining area (Fig. 14.11). The water table range
varies between 6.28 and 3.06 mbgl during 2011–
2013. In the monitoring well the water table is
observed as 3.16 mbgl. It reveals that the tideinduced change in water level is around 1.03 m.
A tidal tracer study was conducted by Acworth
et al. (2007); it revealed greater vertical fluctuations are relative to horizontal movements in
response to tides, which enhanced mixing zone
thickness.
14.1.6 Conclusion
The result of geochemical analysis indicates that
the groundwater in the study area is slightly
alkaline with moderate saline water. The cation
and anion concentrations confirm most of the
groundwater samples belong to the order of
Na
+ > Mg
2+ > Ca
2+ > K
+
and
Cl
− > SO 4
2
− > HCO
−
3 for cations and anions, respectively.
The increasing of EC, TDS, Na, Mg and Cl
concentrations, correlation matrix and ionic
relationship shows a marked increase in salinization in the active mining area and nearby
wells. Spatial distribution map and water quality
index map indicates the poor quality in the active
mining regions. Alteration of the hydrologic
budget due to anthropogenic and mining of dunal
sands has resulted in changes of both the chemical and physical properties of groundwater discharge, and in many cases severely compromises
with the groundwater quality in the coastal
aquifer. The evaporation process is a dominant
responsibility in the present coastal aquifer more
than the rock water interaction and precipitation.
The groundwater fluctuation level in the active
mining sites shows significant variation (±3
to ± 5 m below ground level). This variation is
due to continuous scrapping of dunes along the
coastal stretch, thus declining the storage capacity of groundwater in the shallow aquifer apart
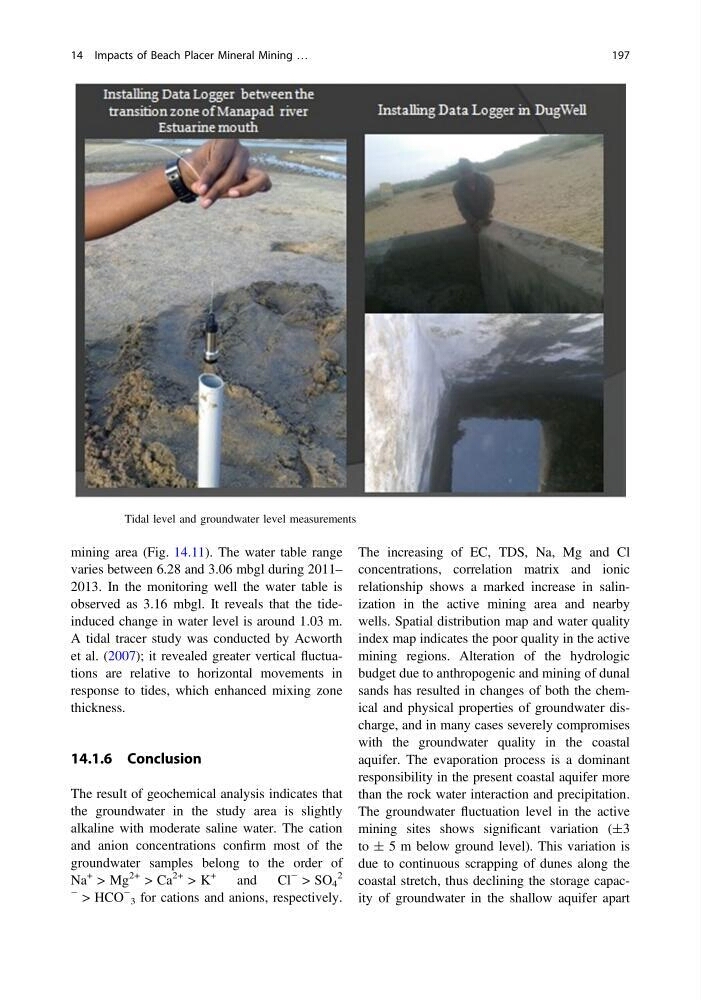
Fig. 14.9 Tidal level and groundwater level measurements
14 Impacts of Beach Placer Mineral Mining …
197
varies between 6.28 and 3.06 mbgl during 2011–
2013. In the monitoring well the water table is
observed as 3.16 mbgl. It reveals that the tideinduced change in water level is around 1.03 m.
A tidal tracer study was conducted by Acworth
et al. (2007); it revealed greater vertical fluctuations are relative to horizontal movements in
response to tides, which enhanced mixing zone
thickness.
14.1.6 Conclusion
The result of geochemical analysis indicates that
the groundwater in the study area is slightly
alkaline with moderate saline water. The cation
and anion concentrations confirm most of the
groundwater samples belong to the order of
Na
+ > Mg
2+ > Ca
2+ > K
+
and
Cl
− > SO 4
2
− > HCO
−
3 for cations and anions, respectively.
The increasing of EC, TDS, Na, Mg and Cl
concentrations, correlation matrix and ionic
relationship shows a marked increase in salinization in the active mining area and nearby
wells. Spatial distribution map and water quality
index map indicates the poor quality in the active
mining regions. Alteration of the hydrologic
budget due to anthropogenic and mining of dunal
sands has resulted in changes of both the chemical and physical properties of groundwater discharge, and in many cases severely compromises
with the groundwater quality in the coastal
aquifer. The evaporation process is a dominant
responsibility in the present coastal aquifer more
than the rock water interaction and precipitation.
The groundwater fluctuation level in the active
mining sites shows significant variation (±3
to ± 5 m below ground level). This variation is
due to continuous scrapping of dunes along the
coastal stretch, thus declining the storage capacity of groundwater in the shallow aquifer apart
Fig. 14.9 Tidal level and groundwater level measurements
14 Impacts of Beach Placer Mineral Mining …
197