

bottled samples were immediately transported to
the laboratory. Field parameters pH, electrical
conductivity corrected to 25 °C (EC), total dissolved solids (TDS) were measured in the field,
with previously calibrated instruments. On-site
testing was necessary for these parameters since
they are likely to change during transport. These
variables were measured by using Hanna portable water quality meter (HI-9828, USA).
Salinity was measured using sodium chloride
refractrometer by using HANNA. The chemical
parameters such as Ca
2+ , Mg
2+ , Na
+
, K
+ and
HCO 3
− , Cl
− , SO 4
2− were determined in the
laboratory following the methods of APHA
(1995). The accuracy of the chemical analysis
has been verified by calculating ionic balance
error which is generally with 5%. The chemical
data were utilized to evaluate the water quality;
ionic concentrations were calculated to characterize the hydrochemical processes, correlation
matrix, ionic relationship, were performed. Various factors controlling groundwater chemistry
were analyzed by Gibb’s diagram to identify the
water quality. The Water Quality Index
(WQI) map was prepared by computing the
individual point data and then plotted in GIS.
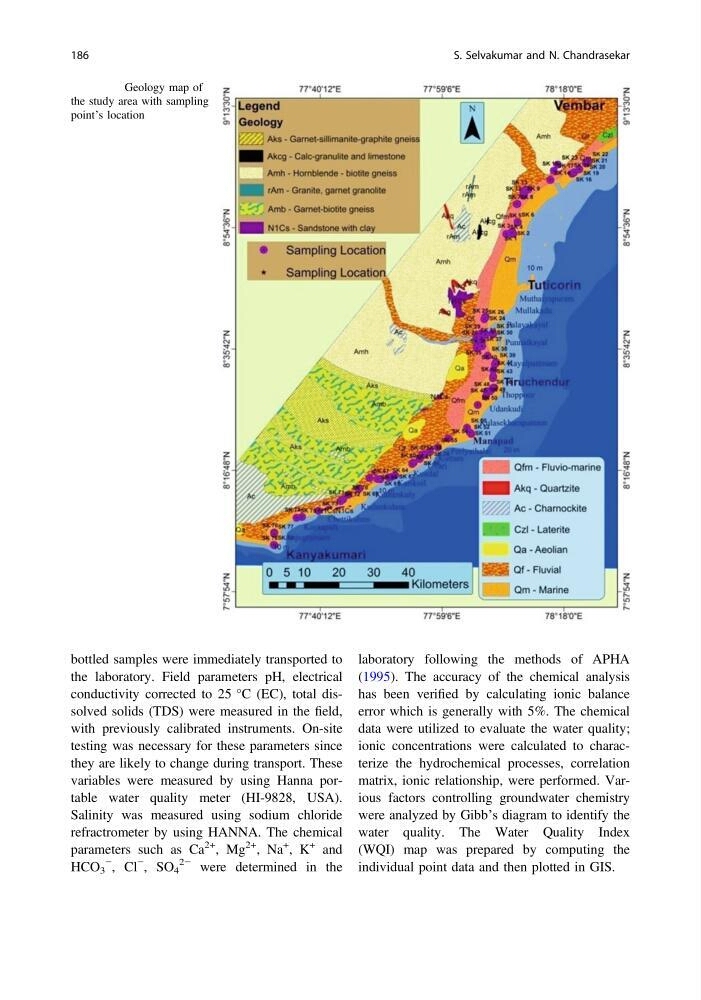
Fig. 14.1 Geology map of
the study area with sampling
point’s location
186
S. Selvakumar and N. Chandrasekar
the laboratory. Field parameters pH, electrical
conductivity corrected to 25 °C (EC), total dissolved solids (TDS) were measured in the field,
with previously calibrated instruments. On-site
testing was necessary for these parameters since
they are likely to change during transport. These
variables were measured by using Hanna portable water quality meter (HI-9828, USA).
Salinity was measured using sodium chloride
refractrometer by using HANNA. The chemical
parameters such as Ca
2+ , Mg
2+ , Na
+
, K
+ and
HCO 3
− , Cl
− , SO 4
2− were determined in the
laboratory following the methods of APHA
(1995). The accuracy of the chemical analysis
has been verified by calculating ionic balance
error which is generally with 5%. The chemical
data were utilized to evaluate the water quality;
ionic concentrations were calculated to characterize the hydrochemical processes, correlation
matrix, ionic relationship, were performed. Various factors controlling groundwater chemistry
were analyzed by Gibb’s diagram to identify the
water quality. The Water Quality Index
(WQI) map was prepared by computing the
individual point data and then plotted in GIS.
Fig. 14.1 Geology map of
the study area with sampling
point’s location
186
S. Selvakumar and N. Chandrasekar