

measurement of cardiac activity of invertebrate
animals with a rigid external skeleton has been
developed (Kholodkevich et al. 2007a, b, 2008,
2013).
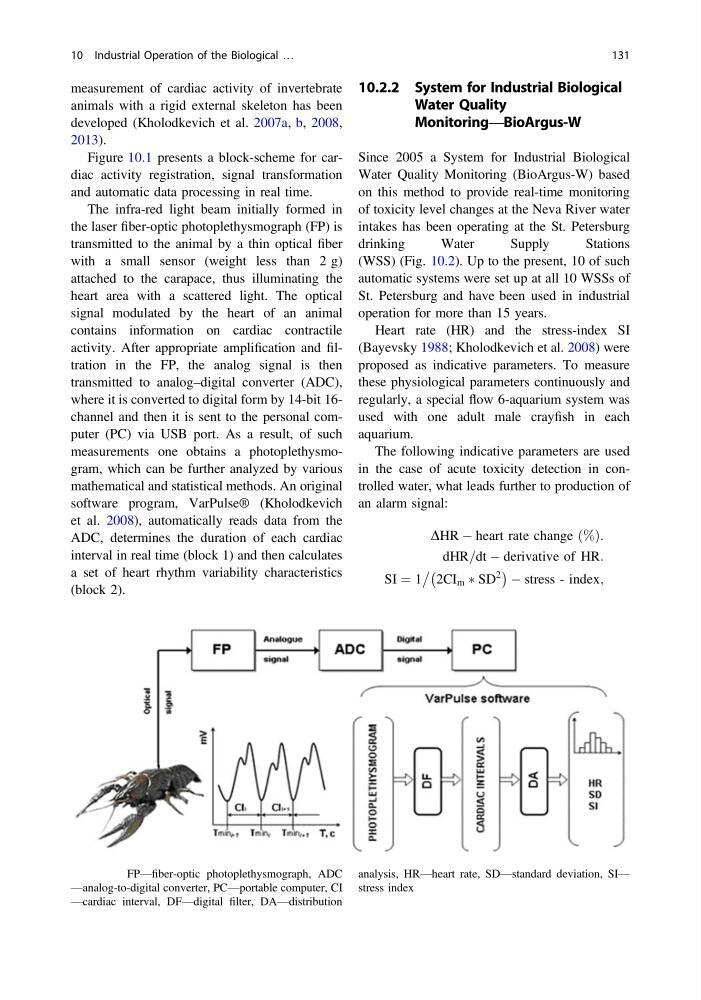
Figure 10.1 presents a block-scheme for cardiac activity registration, signal transformation
and automatic data processing in real time.
The infra-red light beam initially formed in
the laser fiber-optic photoplethysmograph (FP) is
transmitted to the animal by a thin optical fiber
with a small sensor (weight less than 2 g)
attached to the carapace, thus illuminating the
heart area with a scattered light. The optical
signal modulated by the heart of an animal
contains information on cardiac contractile
activity. After appropriate amplification and filtration in the FP, the analog signal is then
transmitted to analog–digital converter (ADC),
where it is converted to digital form by 14-bit 16channel and then it is sent to the personal computer (PC) via USB port. As a result, of such
measurements one obtains a photoplethysmogram, which can be further analyzed by various
mathematical and statistical methods. An original
software program, VarPulse® (Kholodkevich
et al. 2008), automatically reads data from the
ADC, determines the duration of each cardiac
interval in real time (block 1) and then calculates
a set of heart rhythm variability characteristics
(block 2).
10.2.2 System for Industrial Biological
Water Quality
Monitoring—BioArgus-W
Since 2005 a System for Industrial Biological
Water Quality Monitoring (BioArgus-W) based
on this method to provide real-time monitoring
of toxicity level changes at the Neva River water
intakes has been operating at the St. Petersburg
drinking
Water
Supply
Stations
(WSS) (Fig. 10.2). Up to the present, 10 of such
automatic systems were set up at all 10 WSSs of
St. Petersburg and have been used in industrial
operation for more than 15 years.
Heart rate (HR) and the stress-index SI
(Bayevsky 1988; Kholodkevich et al. 2008) were
proposed as indicative parameters. To measure
these physiological parameters continuously and
regularly, a special flow 6-aquarium system was
used with one adult male crayfish in each
aquarium.
The following indicative parameters are used
in the case of acute toxicity detection in controlled water, what leads further to production of
an alarm signal:
DHR À heart rate change ð%Þ:
dHR=dt À derivative of HR:
SI ¼ 1
2CI m à SD
2
À
Á À stress - index;
Fig. 10.1 FP—fiber-optic photoplethysmograph, ADC
—analog-to-digital converter, PC—portable computer, CI
—cardiac interval, DF—digital filter, DA—distribution
analysis, HR—heart rate, SD—standard deviation, SI—
stress index
10 Industrial Operation of the Biological …
131
animals with a rigid external skeleton has been
developed (Kholodkevich et al. 2007a, b, 2008,
2013).
Figure 10.1 presents a block-scheme for cardiac activity registration, signal transformation
and automatic data processing in real time.
The infra-red light beam initially formed in
the laser fiber-optic photoplethysmograph (FP) is
transmitted to the animal by a thin optical fiber
with a small sensor (weight less than 2 g)
attached to the carapace, thus illuminating the
heart area with a scattered light. The optical
signal modulated by the heart of an animal
contains information on cardiac contractile
activity. After appropriate amplification and filtration in the FP, the analog signal is then
transmitted to analog–digital converter (ADC),
where it is converted to digital form by 14-bit 16channel and then it is sent to the personal computer (PC) via USB port. As a result, of such
measurements one obtains a photoplethysmogram, which can be further analyzed by various
mathematical and statistical methods. An original
software program, VarPulse® (Kholodkevich
et al. 2008), automatically reads data from the
ADC, determines the duration of each cardiac
interval in real time (block 1) and then calculates
a set of heart rhythm variability characteristics
(block 2).
10.2.2 System for Industrial Biological
Water Quality
Monitoring—BioArgus-W
Since 2005 a System for Industrial Biological
Water Quality Monitoring (BioArgus-W) based
on this method to provide real-time monitoring
of toxicity level changes at the Neva River water
intakes has been operating at the St. Petersburg
drinking
Water
Supply
Stations
(WSS) (Fig. 10.2). Up to the present, 10 of such
automatic systems were set up at all 10 WSSs of
St. Petersburg and have been used in industrial
operation for more than 15 years.
Heart rate (HR) and the stress-index SI
(Bayevsky 1988; Kholodkevich et al. 2008) were
proposed as indicative parameters. To measure
these physiological parameters continuously and
regularly, a special flow 6-aquarium system was
used with one adult male crayfish in each
aquarium.
The following indicative parameters are used
in the case of acute toxicity detection in controlled water, what leads further to production of
an alarm signal:
DHR À heart rate change ð%Þ:
dHR=dt À derivative of HR:
SI ¼ 1
2CI m à SD
2
À
Á À stress - index;
Fig. 10.1 FP—fiber-optic photoplethysmograph, ADC
—analog-to-digital converter, PC—portable computer, CI
—cardiac interval, DF—digital filter, DA—distribution
analysis, HR—heart rate, SD—standard deviation, SI—
stress index
10 Industrial Operation of the Biological …
131