

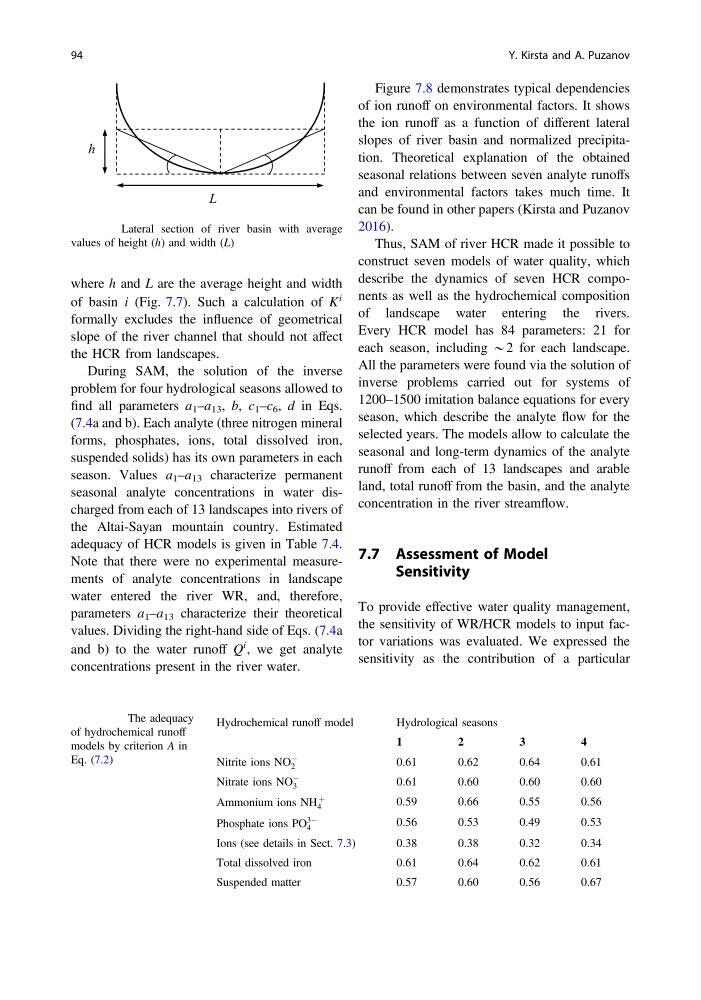
where h and L are the average height and width
of basin i (Fig. 7.7). Such a calculation of K
i
formally excludes the influence of geometrical
slope of the river channel that should not affect
the HCR from landscapes.
During SAM, the solution of the inverse
problem for four hydrological seasons allowed to
find all parameters a 1 –a 13 , b, c 1 –c 6 , d in Eqs.
(7.4a and b). Each analyte (three nitrogen mineral
forms, phosphates, ions, total dissolved iron,
suspended solids) has its own parameters in each
season. Values a 1 –a 13 characterize permanent
seasonal analyte concentrations in water discharged from each of 13 landscapes into rivers of
the Altai-Sayan mountain country. Estimated
adequacy of HCR models is given in Table 7.4.
Note that there were no experimental measurements of analyte concentrations in landscape
water entered the river WR, and, therefore,
parameters a 1 –a 13 characterize their theoretical
values. Dividing the right-hand side of Eqs. (7.4a
and b) to the water runoff Q
i , we get analyte
concentrations present in the river water.
Figure 7.8 demonstrates typical dependencies
of ion runoff on environmental factors. It shows
the ion runoff as a function of different lateral
slopes of river basin and normalized precipitation. Theoretical explanation of the obtained
seasonal relations between seven analyte runoffs
and environmental factors takes much time. It
can be found in other papers (Kirsta and Puzanov
2016).
Thus, SAM of river HCR made it possible to
construct seven models of water quality, which
describe the dynamics of seven HCR components as well as the hydrochemical composition
of landscape water entering the rivers.
Every HCR model has 84 parameters: 21 for
each season, including *2 for each landscape.
All the parameters were found via the solution of
inverse problems carried out for systems of
1200–1500 imitation balance equations for every
season, which describe the analyte flow for the
selected years. The models allow to calculate the
seasonal and long-term dynamics of the analyte
runoff from each of 13 landscapes and arable
land, total runoff from the basin, and the analyte
concentration in the river streamflow.
7.7 Assessment of Model
Sensitivity
To provide effective water quality management,
the sensitivity of WR/HCR models to input factor variations was evaluated. We expressed the
sensitivity as the contribution of a particular
L
h
Fig. 7.7 Lateral section of river basin with average
values of height (h) and width (L)
Table 7.4 The adequacy
of hydrochemical runoff
models by criterion A in
Eq. (7.2)
Hydrochemical runoff model
Hydrological seasons
1
2
3
4
Nitrite ions NO
À
2
0.61
0.62
0.64
0.61
Nitrate ions NO
À
3
0.61
0.60
0.60
0.60
Ammonium ions NH
þ
4
0.59
0.66
0.55
0.56
Phosphate ions PO
3À
4
0.56
0.53
0.49
0.53
Ions (see details in Sect. 7.3)
0.38
0.38
0.32
0.34
Total dissolved iron
0.61
0.64
0.62
0.61
Suspended matter
0.57
0.60
0.56
0.67
94
Y. Kirsta and A. Puzanov
of basin i (Fig. 7.7). Such a calculation of K
i
formally excludes the influence of geometrical
slope of the river channel that should not affect
the HCR from landscapes.
During SAM, the solution of the inverse
problem for four hydrological seasons allowed to
find all parameters a 1 –a 13 , b, c 1 –c 6 , d in Eqs.
(7.4a and b). Each analyte (three nitrogen mineral
forms, phosphates, ions, total dissolved iron,
suspended solids) has its own parameters in each
season. Values a 1 –a 13 characterize permanent
seasonal analyte concentrations in water discharged from each of 13 landscapes into rivers of
the Altai-Sayan mountain country. Estimated
adequacy of HCR models is given in Table 7.4.
Note that there were no experimental measurements of analyte concentrations in landscape
water entered the river WR, and, therefore,
parameters a 1 –a 13 characterize their theoretical
values. Dividing the right-hand side of Eqs. (7.4a
and b) to the water runoff Q
i , we get analyte
concentrations present in the river water.
Figure 7.8 demonstrates typical dependencies
of ion runoff on environmental factors. It shows
the ion runoff as a function of different lateral
slopes of river basin and normalized precipitation. Theoretical explanation of the obtained
seasonal relations between seven analyte runoffs
and environmental factors takes much time. It
can be found in other papers (Kirsta and Puzanov
2016).
Thus, SAM of river HCR made it possible to
construct seven models of water quality, which
describe the dynamics of seven HCR components as well as the hydrochemical composition
of landscape water entering the rivers.
Every HCR model has 84 parameters: 21 for
each season, including *2 for each landscape.
All the parameters were found via the solution of
inverse problems carried out for systems of
1200–1500 imitation balance equations for every
season, which describe the analyte flow for the
selected years. The models allow to calculate the
seasonal and long-term dynamics of the analyte
runoff from each of 13 landscapes and arable
land, total runoff from the basin, and the analyte
concentration in the river streamflow.
7.7 Assessment of Model
Sensitivity
To provide effective water quality management,
the sensitivity of WR/HCR models to input factor variations was evaluated. We expressed the
sensitivity as the contribution of a particular
L
h
Fig. 7.7 Lateral section of river basin with average
values of height (h) and width (L)
Table 7.4 The adequacy
of hydrochemical runoff
models by criterion A in
Eq. (7.2)
Hydrochemical runoff model
Hydrological seasons
1
2
3
4
Nitrite ions NO
À
2
0.61
0.62
0.64
0.61
Nitrate ions NO
À
3
0.61
0.60
0.60
0.60
Ammonium ions NH
þ
4
0.59
0.66
0.55
0.56
Phosphate ions PO
3À
4
0.56
0.53
0.49
0.53
Ions (see details in Sect. 7.3)
0.38
0.38
0.32
0.34
Total dissolved iron
0.61
0.64
0.62
0.61
Suspended matter
0.57
0.60
0.56
0.67
94
Y. Kirsta and A. Puzanov