

410
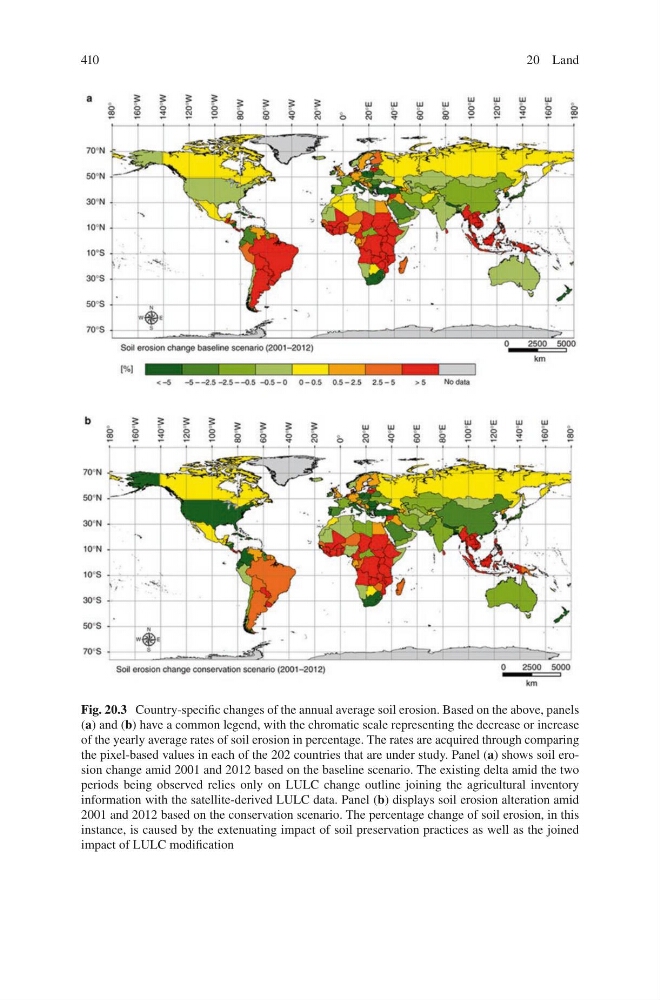
Fig. 20.3 Country-specific changes of the annual average soil erosion. Based on the above, panels
(a) and (b) have a common legend, with the chromatic scale representing the decrease or increase
of the yearly average rates of soil erosion in percentage. The rates are acquired through comparing
the pixel-based values in each of the 202 countries that are under study. Panel (a) shows soil erosion change amid 2001 and 2012 based on the baseline scenario. The existing delta amid the two
periods being observed relies only on LULC change outline joining the agricultural inventory
information with the satellite-derived LULC data. Panel (b) displays soil erosion alteration amid
2001 and 2012 based on the conservation scenario. The percentage change of soil erosion, in this
instance, is caused by the extenuating impact of soil preservation practices as well as the joined
impact of LULC modification
20 Land
Fig. 20.3 Country-specific changes of the annual average soil erosion. Based on the above, panels
(a) and (b) have a common legend, with the chromatic scale representing the decrease or increase
of the yearly average rates of soil erosion in percentage. The rates are acquired through comparing
the pixel-based values in each of the 202 countries that are under study. Panel (a) shows soil erosion change amid 2001 and 2012 based on the baseline scenario. The existing delta amid the two
periods being observed relies only on LULC change outline joining the agricultural inventory
information with the satellite-derived LULC data. Panel (b) displays soil erosion alteration amid
2001 and 2012 based on the conservation scenario. The percentage change of soil erosion, in this
instance, is caused by the extenuating impact of soil preservation practices as well as the joined
impact of LULC modification
20 Land