

135
for producing the electric current is linked linearly to the electricity energy and
temperature and can be stated as follows [45–47]:
I
I
T
S
S
n
n
ph
ph
I
=
+
(
)
,
α ∆
(7.3)
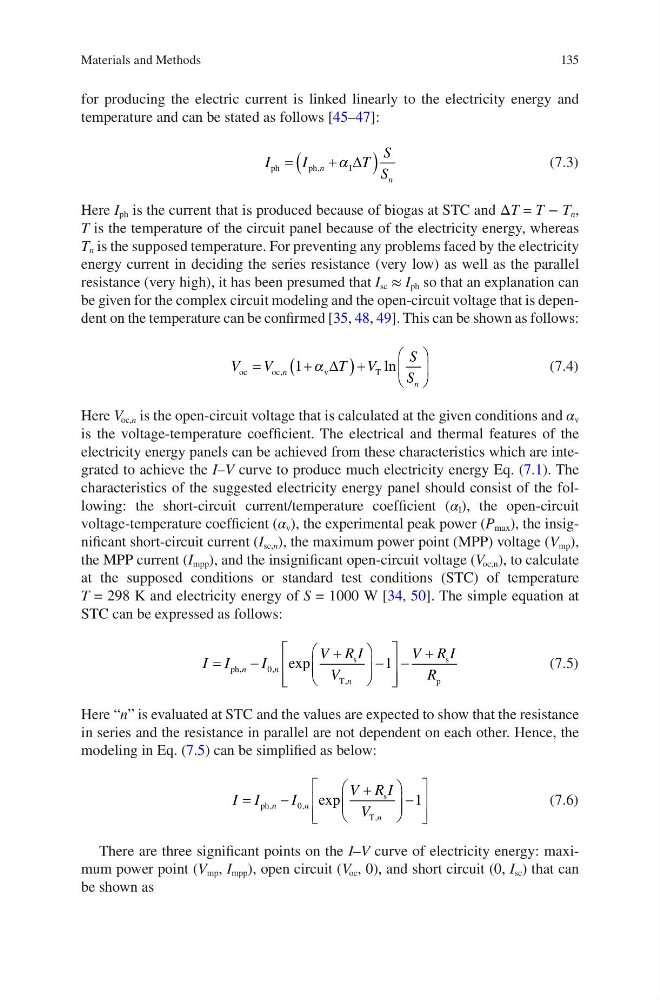
Here I ph is the current that is produced because of biogas at STC and ΔT = T − T n ,
T is the temperature of the circuit panel because of the electricity energy, whereas
T n is the supposed temperature. For preventing any problems faced by the electricity
energy current in deciding the series resistance (very low) as well as the parallel
resistance (very high), it has been presumed that I sc ≈ I ph so that an explanation can
be given for the complex circuit modeling and the open-circuit voltage that is dependent on the temperature can be confirmed [35, 48, 49]. This can be shown as follows:
V
V
T V
S
S
n
n
oc
oc
v
T
=
+
(
)+
,
ln
1 α ∆
(7.4)
Here V oc,n is the open-circuit voltage that is calculated at the given conditions and α v
is the voltage-temperature coefficient. The electrical and thermal features of the
electricity energy panels can be achieved from these characteristics which are integrated to achieve the I–V curve to produce much electricity energy Eq. (7.1). The
characteristics of the suggested electricity energy panel should consist of the following: the short-circuit current/temperature coefficient (α I ), the open-circuit
voltage- temperature coefficient (α v ), the experimental peak power (P max ), the insignificant short-circuit current (I sc,n ), the maximum power point (MPP) voltage (V mp ),
the MPP current (I mpp ), and the insignificant open-circuit voltage (V oc,n ), to calculate
at the supposed conditions or standard test conditions (STC) of temperature
T = 298 K and electricity energy of S = 1000 W [34, 50]. The simple equation at
STC can be expressed as follows:
I I
I
V R I
V
V R I
R
n
n
n
=
−
+
−
−
+
ph
s
T
s
p
,
,
,
exp
0
1
(7.5)
Here “n” is evaluated at STC and the values are expected to show that the resistance
in series and the resistance in parallel are not dependent on each other. Hence, the
modeling in Eq. (7.5) can be simplified as below:
I I
I
V R I
V
n
n
n
=
−
+
−
ph
s
T
,
,
,
exp
0
1
(7.6)
There are three significant points on the I–V curve of electricity energy: maximum power point (V mp , I mpp ), open circuit (V oc , 0), and short circuit (0, I sc ) that can
be shown as
Materials and Methods
for producing the electric current is linked linearly to the electricity energy and
temperature and can be stated as follows [45–47]:
I
I
T
S
S
n
n
ph
ph
I
=
+
(
)
,
α ∆
(7.3)
Here I ph is the current that is produced because of biogas at STC and ΔT = T − T n ,
T is the temperature of the circuit panel because of the electricity energy, whereas
T n is the supposed temperature. For preventing any problems faced by the electricity
energy current in deciding the series resistance (very low) as well as the parallel
resistance (very high), it has been presumed that I sc ≈ I ph so that an explanation can
be given for the complex circuit modeling and the open-circuit voltage that is dependent on the temperature can be confirmed [35, 48, 49]. This can be shown as follows:
V
V
T V
S
S
n
n
oc
oc
v
T
=
+
(
)+
,
ln
1 α ∆
(7.4)
Here V oc,n is the open-circuit voltage that is calculated at the given conditions and α v
is the voltage-temperature coefficient. The electrical and thermal features of the
electricity energy panels can be achieved from these characteristics which are integrated to achieve the I–V curve to produce much electricity energy Eq. (7.1). The
characteristics of the suggested electricity energy panel should consist of the following: the short-circuit current/temperature coefficient (α I ), the open-circuit
voltage- temperature coefficient (α v ), the experimental peak power (P max ), the insignificant short-circuit current (I sc,n ), the maximum power point (MPP) voltage (V mp ),
the MPP current (I mpp ), and the insignificant open-circuit voltage (V oc,n ), to calculate
at the supposed conditions or standard test conditions (STC) of temperature
T = 298 K and electricity energy of S = 1000 W [34, 50]. The simple equation at
STC can be expressed as follows:
I I
I
V R I
V
V R I
R
n
n
n
=
−
+
−
−
+
ph
s
T
s
p
,
,
,
exp
0
1
(7.5)
Here “n” is evaluated at STC and the values are expected to show that the resistance
in series and the resistance in parallel are not dependent on each other. Hence, the
modeling in Eq. (7.5) can be simplified as below:
I I
I
V R I
V
n
n
n
=
−
+
−
ph
s
T
,
,
,
exp
0
1
(7.6)
There are three significant points on the I–V curve of electricity energy: maximum power point (V mp , I mpp ), open circuit (V oc , 0), and short circuit (0, I sc ) that can
be shown as
Materials and Methods