

3.3 Adsorption of Electrolyte Anions
79
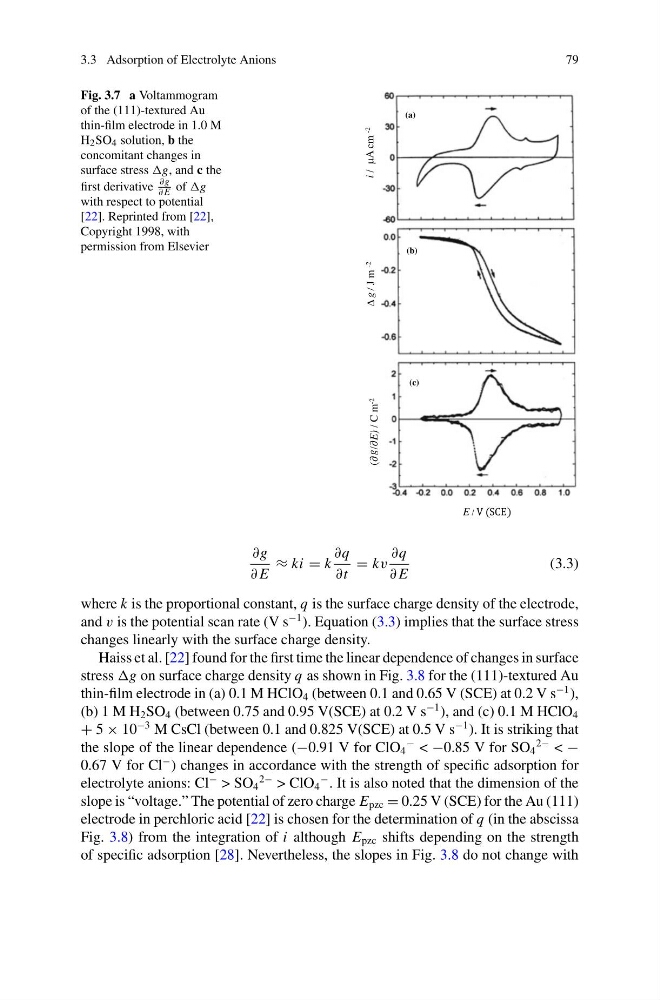
Fig. 3.7 a Voltammogram
of the (111)-textured Au
thin-film electrode in 1.0 M
H 2 SO 4 solution, b the
concomitant changes in
surface stress and c the
first derivative
∂g
∂ E of
with respect to potential
[22]. Reprinted from [22],
Copyright 1998, with
permission from Elsevier
∂g
∂ E
≈ ki = k
∂q
∂t
= kv
∂q
∂ E
(3.3)
where k is the proportional constant, q is the surface charge density of the electrode,
and v is the potential scan rate (V s
−1 ). Equation (3.3) implies that the surface stress
changes linearly with the surface charge density.
Haiss et al. [22] found for the first time the linear dependence of changes in surface
stress on surface charge density q as shown in Fig. 3.8 for the (111)-textured Au
thin-film electrode in (a) 0.1 M HClO 4 (between 0.1 and 0.65 V (SCE) at 0.2 V s
−1 ),
(b) 1 M H 2 SO 4 (between 0.75 and 0.95 V(SCE) at 0.2 V s
−1 ), and (c) 0.1 M HClO 4
+ 5 × 10
−3 M CsCl (between 0.1 and 0.825 V(SCE) at 0.5 V s
−1 ). It is striking that
the slope of the linear dependence (−0.91 V for ClO 4
− < −0.85 V for SO 4
2− < −
0.67 V for Cl
− ) changes in accordance with the strength of specific adsorption for
electrolyte anions: Cl
− > SO 4
2− > ClO 4
− . It is also noted that the dimension of the
slope is “voltage.” The potential of zero charge E pzc = 0.25 V (SCE) for the Au (111)
electrode in perchloric acid [22] is chosen for the determination of q (in the abscissa
Fig. 3.8) from the integration of i although E pzc shifts depending on the strength
of specific adsorption [28]. Nevertheless, the slopes in Fig. 3.8 do not change with
79
Fig. 3.7 a Voltammogram
of the (111)-textured Au
thin-film electrode in 1.0 M
H 2 SO 4 solution, b the
concomitant changes in
surface stress and c the
first derivative
∂g
∂ E of
with respect to potential
[22]. Reprinted from [22],
Copyright 1998, with
permission from Elsevier
∂g
∂ E
≈ ki = k
∂q
∂t
= kv
∂q
∂ E
(3.3)
where k is the proportional constant, q is the surface charge density of the electrode,
and v is the potential scan rate (V s
−1 ). Equation (3.3) implies that the surface stress
changes linearly with the surface charge density.
Haiss et al. [22] found for the first time the linear dependence of changes in surface
stress on surface charge density q as shown in Fig. 3.8 for the (111)-textured Au
thin-film electrode in (a) 0.1 M HClO 4 (between 0.1 and 0.65 V (SCE) at 0.2 V s
−1 ),
(b) 1 M H 2 SO 4 (between 0.75 and 0.95 V(SCE) at 0.2 V s
−1 ), and (c) 0.1 M HClO 4
+ 5 × 10
−3 M CsCl (between 0.1 and 0.825 V(SCE) at 0.5 V s
−1 ). It is striking that
the slope of the linear dependence (−0.91 V for ClO 4
− < −0.85 V for SO 4
2− < −
0.67 V for Cl
− ) changes in accordance with the strength of specific adsorption for
electrolyte anions: Cl
− > SO 4
2− > ClO 4
− . It is also noted that the dimension of the
slope is “voltage.” The potential of zero charge E pzc = 0.25 V (SCE) for the Au (111)
electrode in perchloric acid [22] is chosen for the determination of q (in the abscissa
Fig. 3.8) from the integration of i although E pzc shifts depending on the strength
of specific adsorption [28]. Nevertheless, the slopes in Fig. 3.8 do not change with