

72
3 Potential- or Adsorbate-Induced Changes in Surface Stress …
1.46
1.44
1.42
1.40
1.38
1.36
1.34
/ J m
-2
0.6
0.4
0.2
0.0
-0.2
E / V (SCE)
Au (100)-(1x1)
Au (100)-(hex)
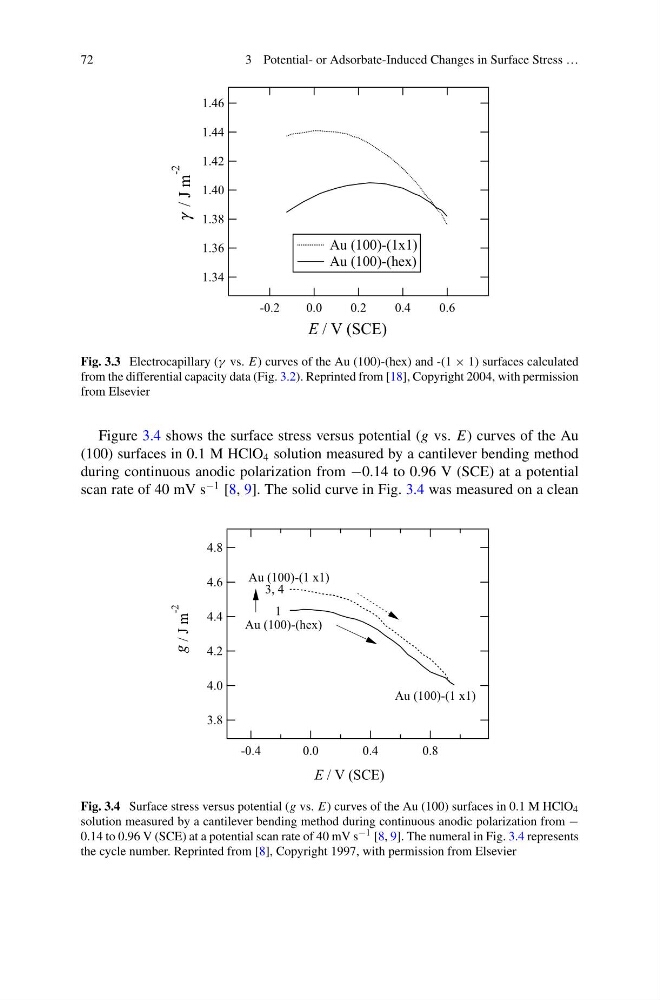
Fig. 3.3 Electrocapillary (γ vs. E) curves of the Au (100)-(hex) and -(1 × 1) surfaces calculated
from the differential capacity data (Fig. 3.2). Reprinted from [18], Copyright 2004, with permission
from Elsevier
Figure 3.4 shows the surface stress versus potential (g vs. E) curves of the Au
(100) surfaces in 0.1 M HClO 4 solution measured by a cantilever bending method
during continuous anodic polarization from −0.14 to 0.96 V (SCE) at a potential
scan rate of 40 mV s
−1 [8, 9]. The solid curve in Fig. 3.4 was measured on a clean
4.8
4.6
4.4
4.2
4.0
3.8
/ J m
-2
0.8
0.4
0.0
-0.4
E / V (SCE)
1
3, 4
Au (100)-(1 x1)
Au (100)-(1 x1)
Au (100)-(hex)
g
Fig. 3.4 Surface stress versus potential (g vs. E) curves of the Au (100) surfaces in 0.1 M HClO 4
solution measured by a cantilever bending method during continuous anodic polarization from −
0.14 to 0.96 V (SCE) at a potential scan rate of 40 mV s −1 [8, 9]. The numeral in Fig. 3.4 represents
the cycle number. Reprinted from [8], Copyright 1997, with permission from Elsevier
3 Potential- or Adsorbate-Induced Changes in Surface Stress …
1.46
1.44
1.42
1.40
1.38
1.36
1.34
/ J m
-2
0.6
0.4
0.2
0.0
-0.2
E / V (SCE)
Au (100)-(1x1)
Au (100)-(hex)
Fig. 3.3 Electrocapillary (γ vs. E) curves of the Au (100)-(hex) and -(1 × 1) surfaces calculated
from the differential capacity data (Fig. 3.2). Reprinted from [18], Copyright 2004, with permission
from Elsevier
Figure 3.4 shows the surface stress versus potential (g vs. E) curves of the Au
(100) surfaces in 0.1 M HClO 4 solution measured by a cantilever bending method
during continuous anodic polarization from −0.14 to 0.96 V (SCE) at a potential
scan rate of 40 mV s
−1 [8, 9]. The solid curve in Fig. 3.4 was measured on a clean
4.8
4.6
4.4
4.2
4.0
3.8
/ J m
-2
0.8
0.4
0.0
-0.4
E / V (SCE)
1
3, 4
Au (100)-(1 x1)
Au (100)-(1 x1)
Au (100)-(hex)
g
Fig. 3.4 Surface stress versus potential (g vs. E) curves of the Au (100) surfaces in 0.1 M HClO 4
solution measured by a cantilever bending method during continuous anodic polarization from −
0.14 to 0.96 V (SCE) at a potential scan rate of 40 mV s −1 [8, 9]. The numeral in Fig. 3.4 represents
the cycle number. Reprinted from [8], Copyright 1997, with permission from Elsevier