

2.4 Elastic Deformation of Metal Electrode Associated with Surface Stress
61
(a) Scheme of the experimental setup
1
2
3
4
5
6
7
8
(1) Polyimide (Kapton) sheet
(2) Working electrode
(3) Mobile grip
(4) Fixed grip
(5) Reference electrode
with Luggin capillary
(6) Counter electrode
(7) Lock-in amplifier
(8) Potentiostat
10 mm
25 mm
(b)
(9) Au thin film
(10) Kapton substrate
(11) Contact delimitation of solution
to electrode surface
Top view of working electrode
9
10
11
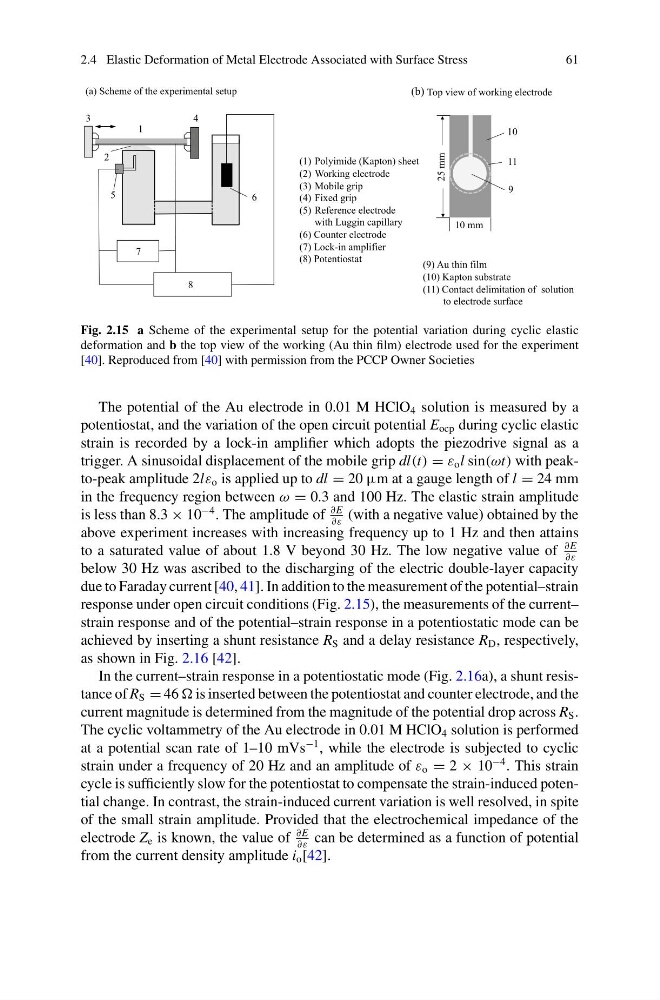
Fig. 2.15 a Scheme of the experimental setup for the potential variation during cyclic elastic
deformation and b the top view of the working (Au thin film) electrode used for the experiment
[40]. Reproduced from [40] with permission from the PCCP Owner Societies
The potential of the Au electrode in 0.01 M HClO 4 solution is measured by a
potentiostat, and the variation of the open circuit potential E ocp during cyclic elastic
strain is recorded by a lock-in amplifier which adopts the piezodrive signal as a
trigger. A sinusoidal displacement of the mobile grip dl(t) = ε o l sin(ωt) with peakto-peak amplitude 2lε o is applied up to dl = 20 µm at a gauge length of l = 24 mm
in the frequency region between ω = 0.3 and 100 Hz. The elastic strain amplitude
is less than 8.3 × 10
−4 . The amplitude of
∂E
∂ε
(with a negative value) obtained by the
above experiment increases with increasing frequency up to 1 Hz and then attains
to a saturated value of about 1.8 V beyond 30 Hz. The low negative value of
∂E
∂ε
below 30 Hz was ascribed to the discharging of the electric double-layer capacity
due to Faraday current [40, 41]. In addition to the measurement of the potential–strain
response under open circuit conditions (Fig. 2.15), the measurements of the current–
strain response and of the potential–strain response in a potentiostatic mode can be
achieved by inserting a shunt resistance R S and a delay resistance R D , respectively,
as shown in Fig. 2.16 [42].
In the current–strain response in a potentiostatic mode (Fig. 2.16a), a shunt resistance of R S = 46 is inserted between the potentiostat and counter electrode, and the
current magnitude is determined from the magnitude of the potential drop across R S .
The cyclic voltammetry of the Au electrode in 0.01 M HClO 4 solution is performed
at a potential scan rate of 1–10 mVs
−1 , while the electrode is subjected to cyclic
strain under a frequency of 20 Hz and an amplitude of ε o = 2 × 10
−4 . This strain
cycle is sufficiently slow for the potentiostat to compensate the strain-induced potential change. In contrast, the strain-induced current variation is well resolved, in spite
of the small strain amplitude. Provided that the electrochemical impedance of the
electrode Z e is known, the value of
∂E
∂ε
can be determined as a function of potential
from the current density amplitude i o [42].
61
(a) Scheme of the experimental setup
1
2
3
4
5
6
7
8
(1) Polyimide (Kapton) sheet
(2) Working electrode
(3) Mobile grip
(4) Fixed grip
(5) Reference electrode
with Luggin capillary
(6) Counter electrode
(7) Lock-in amplifier
(8) Potentiostat
10 mm
25 mm
(b)
(9) Au thin film
(10) Kapton substrate
(11) Contact delimitation of solution
to electrode surface
Top view of working electrode
9
10
11
Fig. 2.15 a Scheme of the experimental setup for the potential variation during cyclic elastic
deformation and b the top view of the working (Au thin film) electrode used for the experiment
[40]. Reproduced from [40] with permission from the PCCP Owner Societies
The potential of the Au electrode in 0.01 M HClO 4 solution is measured by a
potentiostat, and the variation of the open circuit potential E ocp during cyclic elastic
strain is recorded by a lock-in amplifier which adopts the piezodrive signal as a
trigger. A sinusoidal displacement of the mobile grip dl(t) = ε o l sin(ωt) with peakto-peak amplitude 2lε o is applied up to dl = 20 µm at a gauge length of l = 24 mm
in the frequency region between ω = 0.3 and 100 Hz. The elastic strain amplitude
is less than 8.3 × 10
−4 . The amplitude of
∂E
∂ε
(with a negative value) obtained by the
above experiment increases with increasing frequency up to 1 Hz and then attains
to a saturated value of about 1.8 V beyond 30 Hz. The low negative value of
∂E
∂ε
below 30 Hz was ascribed to the discharging of the electric double-layer capacity
due to Faraday current [40, 41]. In addition to the measurement of the potential–strain
response under open circuit conditions (Fig. 2.15), the measurements of the current–
strain response and of the potential–strain response in a potentiostatic mode can be
achieved by inserting a shunt resistance R S and a delay resistance R D , respectively,
as shown in Fig. 2.16 [42].
In the current–strain response in a potentiostatic mode (Fig. 2.16a), a shunt resistance of R S = 46 is inserted between the potentiostat and counter electrode, and the
current magnitude is determined from the magnitude of the potential drop across R S .
The cyclic voltammetry of the Au electrode in 0.01 M HClO 4 solution is performed
at a potential scan rate of 1–10 mVs
−1 , while the electrode is subjected to cyclic
strain under a frequency of 20 Hz and an amplitude of ε o = 2 × 10
−4 . This strain
cycle is sufficiently slow for the potentiostat to compensate the strain-induced potential change. In contrast, the strain-induced current variation is well resolved, in spite
of the small strain amplitude. Provided that the electrochemical impedance of the
electrode Z e is known, the value of
∂E
∂ε
can be determined as a function of potential
from the current density amplitude i o [42].