

2.2 Piezoelectric Detection of Differential Surface Stress
45
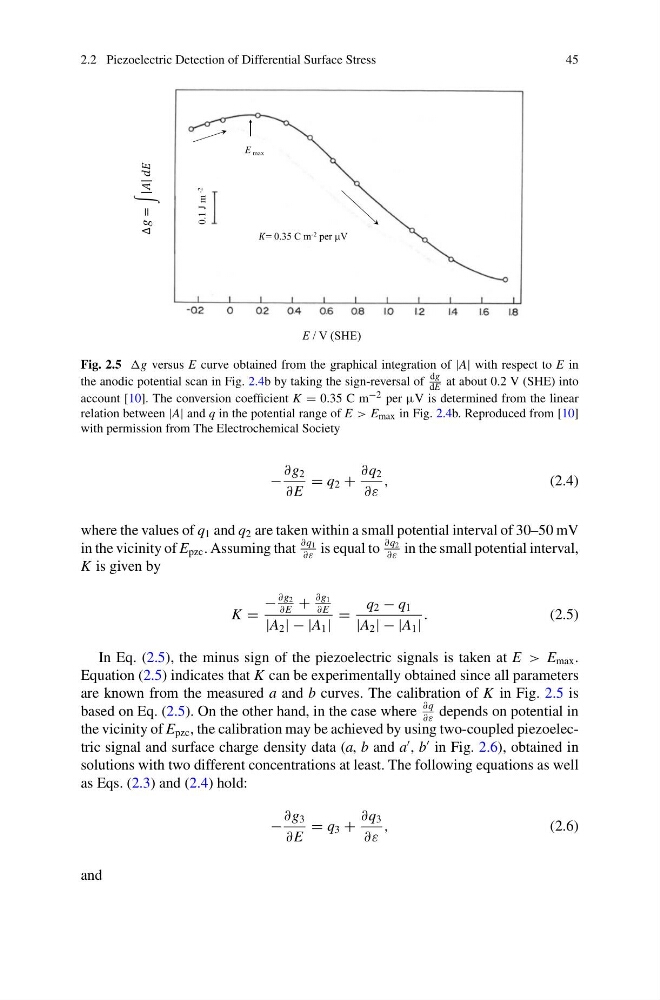
Fig. 2.5 versus E curve obtained from the graphical integration of |A| with respect to E in
the anodic potential scan in Fig. 2.4b by taking the sign-reversal of
dg
dE at about 0.2 V (SHE) into
account [10]. The conversion coefficient K = 0.35 C m −2 per µV is determined from the linear
relation between |A| and q in the potential range of E > E max in Fig. 2.4b. Reproduced from [10]
with permission from The Electrochemical Society
−
∂g 2
∂E
= q 2 +
∂q 2
∂ε
,
(2.4)
where the values of q 1 and q 2 are taken within a small potential interval of 30–50 mV
in the vicinity of E pzc . Assuming that
∂q 1
∂ε
is equal to
∂q 2
∂ε
in the small potential interval,
K is given by
K =
−
∂g 2
∂E
+
∂g 1
∂E
|A 2 | − |A 1 |
=
q 2 − q 1
|A 2 | − |A 1 |
.
(2.5)
In Eq. (2.5), the minus sign of the piezoelectric signals is taken at E > E max .
Equation (2.5) indicates that K can be experimentally obtained since all parameters
are known from the measured a and b curves. The calibration of K in Fig. 2.5 is
based on Eq. (2.5). On the other hand, in the case where
∂q
∂ε
depends on potential in
the vicinity of E pzc , the calibration may be achieved by using two-coupled piezoelectric signal and surface charge density data (a, b and a
, b
in Fig. 2.6), obtained in
solutions with two different concentrations at least. The following equations as well
as Eqs. (2.3) and (2.4) hold:
−
∂g 3
∂E
= q 3 +
∂q 3
∂ε
,
(2.6)
and
45
Fig. 2.5 versus E curve obtained from the graphical integration of |A| with respect to E in
the anodic potential scan in Fig. 2.4b by taking the sign-reversal of
dg
dE at about 0.2 V (SHE) into
account [10]. The conversion coefficient K = 0.35 C m −2 per µV is determined from the linear
relation between |A| and q in the potential range of E > E max in Fig. 2.4b. Reproduced from [10]
with permission from The Electrochemical Society
−
∂g 2
∂E
= q 2 +
∂q 2
∂ε
,
(2.4)
where the values of q 1 and q 2 are taken within a small potential interval of 30–50 mV
in the vicinity of E pzc . Assuming that
∂q 1
∂ε
is equal to
∂q 2
∂ε
in the small potential interval,
K is given by
K =
−
∂g 2
∂E
+
∂g 1
∂E
|A 2 | − |A 1 |
=
q 2 − q 1
|A 2 | − |A 1 |
.
(2.5)
In Eq. (2.5), the minus sign of the piezoelectric signals is taken at E > E max .
Equation (2.5) indicates that K can be experimentally obtained since all parameters
are known from the measured a and b curves. The calibration of K in Fig. 2.5 is
based on Eq. (2.5). On the other hand, in the case where
∂q
∂ε
depends on potential in
the vicinity of E pzc , the calibration may be achieved by using two-coupled piezoelectric signal and surface charge density data (a, b and a
, b
in Fig. 2.6), obtained in
solutions with two different concentrations at least. The following equations as well
as Eqs. (2.3) and (2.4) hold:
−
∂g 3
∂E
= q 3 +
∂q 3
∂ε
,
(2.6)
and