

1.10 Surface Stress versus Potential Curve of Solid Metal Electrode
33
0.6
0.4
0.2
0.0
' / J m
-2
1.0
0.5
0.0
-0.5
E / V (SHE)
Au
0.1 M KCl
g
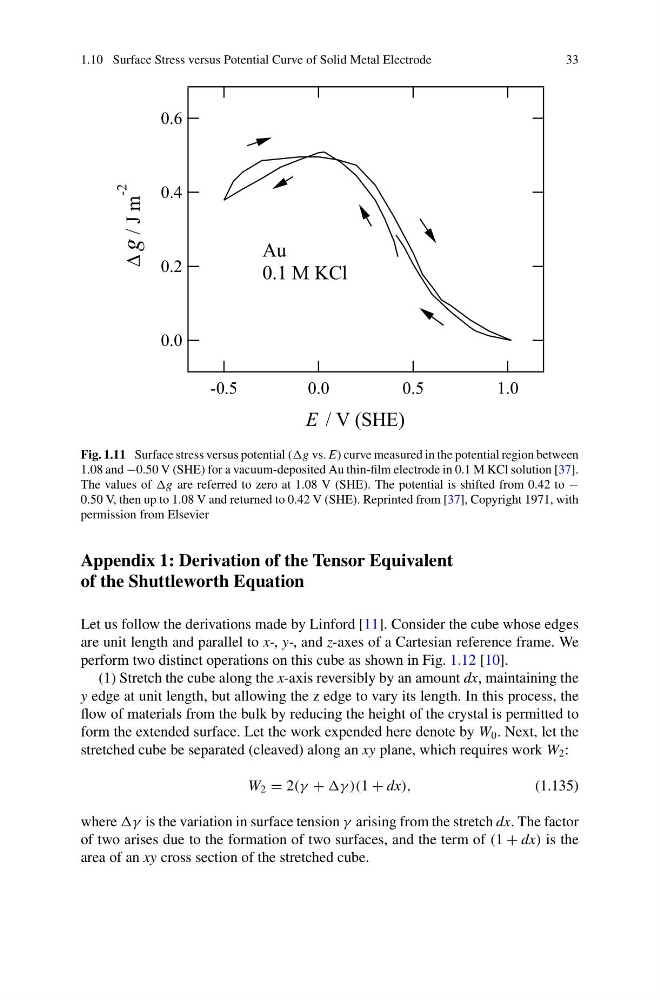
Fig. 1.11 Surface stress versus potential ((g vs. E) curve measured in the potential region between
1.08 and −0.50 V (SHE) for a vacuum-deposited Au thin-film electrode in 0.1 M KCl solution [37].
The values of are referred to zero at 1.08 V (SHE). The potential is shifted from 0.42 to −
0.50 V, then up to 1.08 V and returned to 0.42 V (SHE). Reprinted from [37], Copyright 1971, with
permission from Elsevier
Appendix 1: Derivation of the Tensor Equivalent
of the Shuttleworth Equation
Let us follow the derivations made by Linford [11]. Consider the cube whose edges
are unit length and parallel to x-, y-, and z-axes of a Cartesian reference frame. We
perform two distinct operations on this cube as shown in Fig. 1.12 [10].
(1) Stretch the cube along the x-axis reversibly by an amount dx, maintaining the
y edge at unit length, but allowing the z edge to vary its length. In this process, the
flow of materials from the bulk by reducing the height of the crystal is permitted to
form the extended surface. Let the work expended here denote by W 0 . Next, let the
stretched cube be separated (cleaved) along an xy plane, which requires work W 2 :
W 2 = 2(γ + γ )(1 + dx),
(1.135)
where γ is the variation in surface tension γ arising from the stretch dx. The factor
of two arises due to the formation of two surfaces, and the term of (1 + dx) is the
area of an xy cross section of the stretched cube.
33
0.6
0.4
0.2
0.0
' / J m
-2
1.0
0.5
0.0
-0.5
E / V (SHE)
Au
0.1 M KCl
g
Fig. 1.11 Surface stress versus potential ((g vs. E) curve measured in the potential region between
1.08 and −0.50 V (SHE) for a vacuum-deposited Au thin-film electrode in 0.1 M KCl solution [37].
The values of are referred to zero at 1.08 V (SHE). The potential is shifted from 0.42 to −
0.50 V, then up to 1.08 V and returned to 0.42 V (SHE). Reprinted from [37], Copyright 1971, with
permission from Elsevier
Appendix 1: Derivation of the Tensor Equivalent
of the Shuttleworth Equation
Let us follow the derivations made by Linford [11]. Consider the cube whose edges
are unit length and parallel to x-, y-, and z-axes of a Cartesian reference frame. We
perform two distinct operations on this cube as shown in Fig. 1.12 [10].
(1) Stretch the cube along the x-axis reversibly by an amount dx, maintaining the
y edge at unit length, but allowing the z edge to vary its length. In this process, the
flow of materials from the bulk by reducing the height of the crystal is permitted to
form the extended surface. Let the work expended here denote by W 0 . Next, let the
stretched cube be separated (cleaved) along an xy plane, which requires work W 2 :
W 2 = 2(γ + γ )(1 + dx),
(1.135)
where γ is the variation in surface tension γ arising from the stretch dx. The factor
of two arises due to the formation of two surfaces, and the term of (1 + dx) is the
area of an xy cross section of the stretched cube.