

7.4 Nano-Mechanical Properties of Passive Metal Surfaces Obtained …
203
film. After the cathodic reduction, the Fe specimens were anodically polarized at a
constant potential in the passive potential region between 0.0 V and 1.0 V (SHE) for
1 h in the renewed solution for electrochemical nano-indentation. The load-depth
curves of the Fe specimens passivated at a constant potential were measured twenty
times at a maximum load of L max = 100 − 500 μN for each loading and unloading
time of 5 s and then were averaged because of fluctuation in each load-depth curve.
Figure 7.19 shows the averaged load-depth curves of the Fe (100) and (110)
surfaces passivated at 0.25 V (SHE) in pH 8.4 borate solution [24]. The indentation
depth h max at each maximum load for the passive Fe (110) surface is always smaller
than that for the passive Fe (100) surface, indicating that the hardness of the passive
Fe (110) surface is higher than that of the passive Fe (100) surface. The similar
averaged load-depth curves at various maximum loads were obtained for the Fe
(100) and (110) surfaces passivated at other potentials. The values of hardness H for
the passive Fe (100) and Fe (110) surfaces determined from the averaged load-depth
curves at L max = 400 μN by using the Oliver–Pharr method [1, 2] are plotted as a
function of applied potential in Fig. 7.20 [24]. The values of H for the passive Fe
(100) and Fe (110) surfaces range from 2.9 GPa to 3.3 GPa, and they tend to increase
linearly with increasing potential. The slope of the linear relationship between H
and E is about 0.2 GPa V
−1 , irrespective of the Fe crystal orientation, although the
value of H for the passive Fe (110) surface is higher by about 10% than that for the
passive Fe (100) surface.
An ellipsometrical study [54] indicated that the thickness of passive film formed
on polycrystalline iron for 1 h at a constant potential in pH 8.4 borate solution
increases linearly with increasing potential. The dashed line in Fig. 7.20 represents
the linear relationship between thickness of passive film d f and potential E. The
-100
-50
0
50
100
Current density,
i / µA
cm
-2
1.5
1.0
0.5
0.0
-0.5
-1.0
Potential, E / V (SHE)
pH 8.4 borate solution
Fe (100)
Fe (110)
Passive region
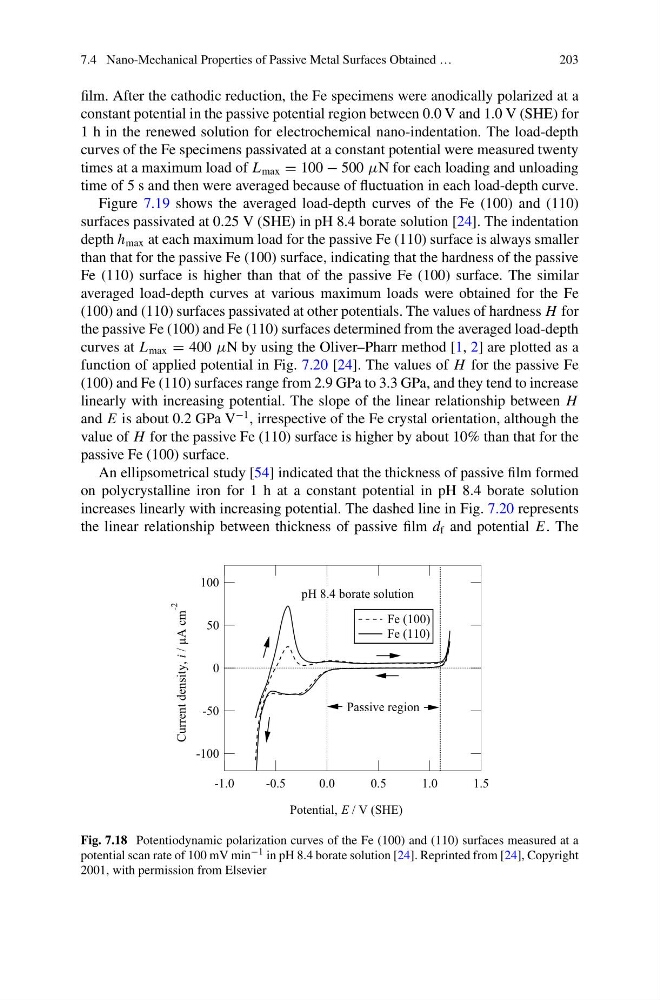
Fig. 7.18 Potentiodynamic polarization curves of the Fe (100) and (110) surfaces measured at a
potential scan rate of 100 mV min −1 in pH 8.4 borate solution [24]. Reprinted from [24], Copyright
2001, with permission from Elsevier
203
film. After the cathodic reduction, the Fe specimens were anodically polarized at a
constant potential in the passive potential region between 0.0 V and 1.0 V (SHE) for
1 h in the renewed solution for electrochemical nano-indentation. The load-depth
curves of the Fe specimens passivated at a constant potential were measured twenty
times at a maximum load of L max = 100 − 500 μN for each loading and unloading
time of 5 s and then were averaged because of fluctuation in each load-depth curve.
Figure 7.19 shows the averaged load-depth curves of the Fe (100) and (110)
surfaces passivated at 0.25 V (SHE) in pH 8.4 borate solution [24]. The indentation
depth h max at each maximum load for the passive Fe (110) surface is always smaller
than that for the passive Fe (100) surface, indicating that the hardness of the passive
Fe (110) surface is higher than that of the passive Fe (100) surface. The similar
averaged load-depth curves at various maximum loads were obtained for the Fe
(100) and (110) surfaces passivated at other potentials. The values of hardness H for
the passive Fe (100) and Fe (110) surfaces determined from the averaged load-depth
curves at L max = 400 μN by using the Oliver–Pharr method [1, 2] are plotted as a
function of applied potential in Fig. 7.20 [24]. The values of H for the passive Fe
(100) and Fe (110) surfaces range from 2.9 GPa to 3.3 GPa, and they tend to increase
linearly with increasing potential. The slope of the linear relationship between H
and E is about 0.2 GPa V
−1 , irrespective of the Fe crystal orientation, although the
value of H for the passive Fe (110) surface is higher by about 10% than that for the
passive Fe (100) surface.
An ellipsometrical study [54] indicated that the thickness of passive film formed
on polycrystalline iron for 1 h at a constant potential in pH 8.4 borate solution
increases linearly with increasing potential. The dashed line in Fig. 7.20 represents
the linear relationship between thickness of passive film d f and potential E. The
-100
-50
0
50
100
Current density,
i / µA
cm
-2
1.5
1.0
0.5
0.0
-0.5
-1.0
Potential, E / V (SHE)
pH 8.4 borate solution
Fe (100)
Fe (110)
Passive region
Fig. 7.18 Potentiodynamic polarization curves of the Fe (100) and (110) surfaces measured at a
potential scan rate of 100 mV min −1 in pH 8.4 borate solution [24]. Reprinted from [24], Copyright
2001, with permission from Elsevier