

7.3 Nano-Mechanical Properties of Solid Surfaces Obtained by Nano- …
189
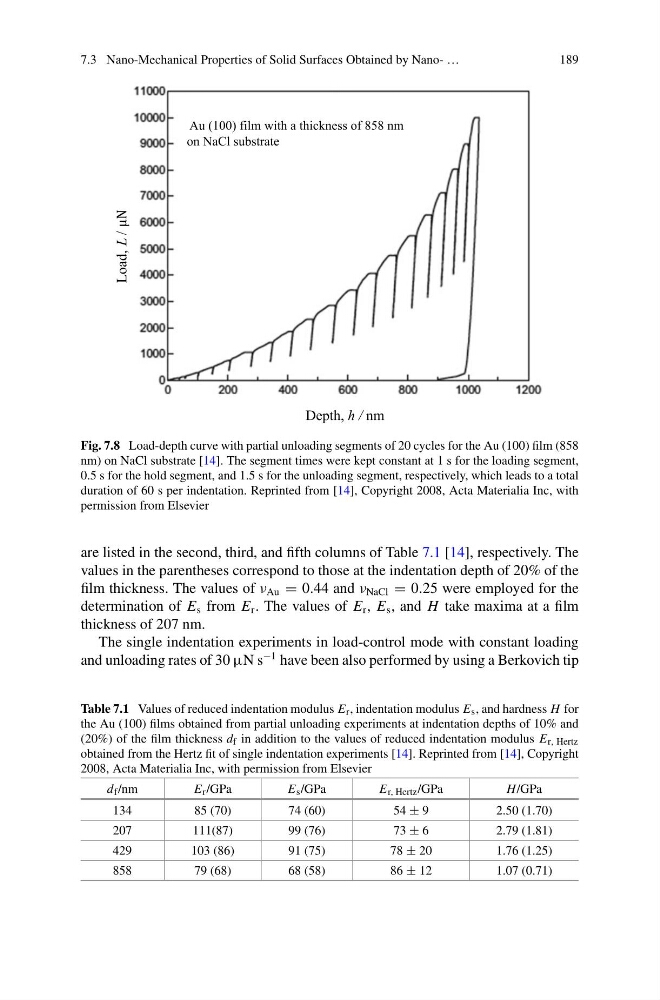
Fig. 7.8 Load-depth curve with partial unloading segments of 20 cycles for the Au (100) film (858
nm) on NaCl substrate [14]. The segment times were kept constant at 1 s for the loading segment,
0.5 s for the hold segment, and 1.5 s for the unloading segment, respectively, which leads to a total
duration of 60 s per indentation. Reprinted from [14], Copyright 2008, Acta Materialia Inc, with
permission from Elsevier
are listed in the second, third, and fifth columns of Table 7.1 [14], respectively. The
values in the parentheses correspond to those at the indentation depth of 20% of the
film thickness. The values of ν Au = 0.44 and ν NaCl = 0.25 were employed for the
determination of E s from E r . The values of E r , E s , and H take maxima at a film
thickness of 207 nm.
The single indentation experiments in load-control mode with constant loading
and unloading rates of 30 µN s
−1 have been also performed by using a Berkovich tip
Table 7.1 Values of reduced indentation modulus E r , indentation modulus E s , and hardness H for
the Au (100) films obtained from partial unloading experiments at indentation depths of 10% and
(20%) of the film thickness d f in addition to the values of reduced indentation modulus E r, Hertz
obtained from the Hertz fit of single indentation experiments [14]. Reprinted from [14], Copyright
2008, Acta Materialia Inc, with permission from Elsevier
d f /nm
E r /GPa
E s /GPa
E r, Hertz /GPa
H/GPa
134
85 (70)
74 (60)
54 ± 9
2.50 (1.70)
207
111(87)
99 (76)
73 ± 6
2.79 (1.81)
429
103 (86)
91 (75)
78 ± 20
1.76 (1.25)
858
79 (68)
68 (58)
86 ± 12
1.07 (0.71)
189
Fig. 7.8 Load-depth curve with partial unloading segments of 20 cycles for the Au (100) film (858
nm) on NaCl substrate [14]. The segment times were kept constant at 1 s for the loading segment,
0.5 s for the hold segment, and 1.5 s for the unloading segment, respectively, which leads to a total
duration of 60 s per indentation. Reprinted from [14], Copyright 2008, Acta Materialia Inc, with
permission from Elsevier
are listed in the second, third, and fifth columns of Table 7.1 [14], respectively. The
values in the parentheses correspond to those at the indentation depth of 20% of the
film thickness. The values of ν Au = 0.44 and ν NaCl = 0.25 were employed for the
determination of E s from E r . The values of E r , E s , and H take maxima at a film
thickness of 207 nm.
The single indentation experiments in load-control mode with constant loading
and unloading rates of 30 µN s
−1 have been also performed by using a Berkovich tip
Table 7.1 Values of reduced indentation modulus E r , indentation modulus E s , and hardness H for
the Au (100) films obtained from partial unloading experiments at indentation depths of 10% and
(20%) of the film thickness d f in addition to the values of reduced indentation modulus E r, Hertz
obtained from the Hertz fit of single indentation experiments [14]. Reprinted from [14], Copyright
2008, Acta Materialia Inc, with permission from Elsevier
d f /nm
E r /GPa
E s /GPa
E r, Hertz /GPa
H/GPa
134
85 (70)
74 (60)
54 ± 9
2.50 (1.70)
207
111(87)
99 (76)
73 ± 6
2.79 (1.81)
429
103 (86)
91 (75)
78 ± 20
1.76 (1.25)
858
79 (68)
68 (58)
86 ± 12
1.07 (0.71)