

3.4 Surface Stress Versus Surface Charge Density or Potential …
97
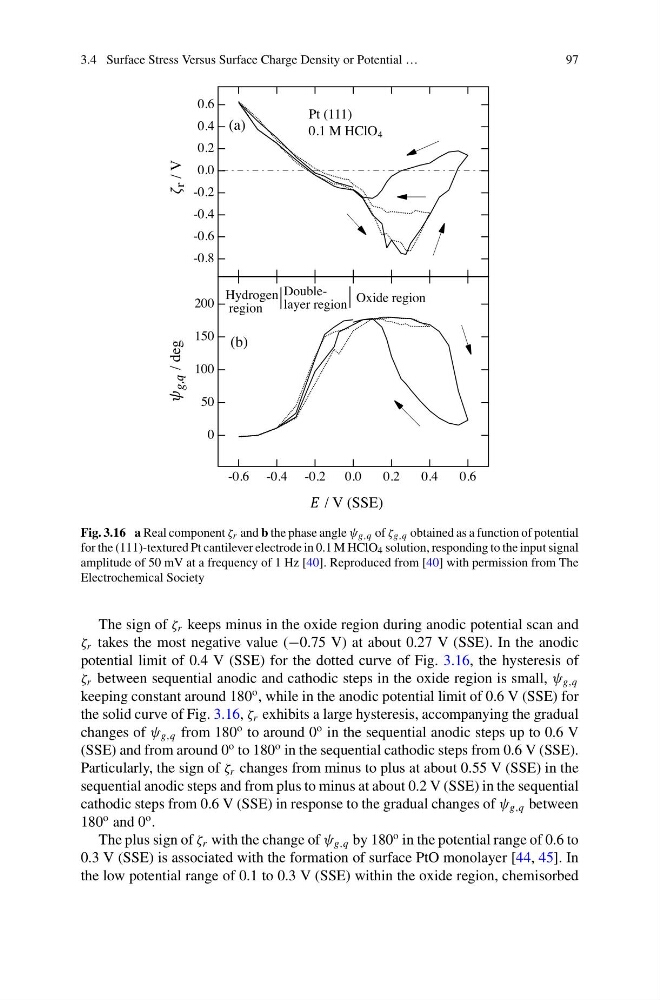
Fig. 3.16 a Real component ζ r and b the phase angle ψ g,q of ζ g,q obtained as a function of potential
for the (111)-textured Pt cantilever electrode in 0.1 M HClO 4 solution, responding to the input signal
amplitude of 50 mV at a frequency of 1 Hz [40]. Reproduced from [40] with permission from The
Electrochemical Society
The sign of ζ r keeps minus in the oxide region during anodic potential scan and
ζ r takes the most negative value (−0.75 V) at about 0.27 V (SSE). In the anodic
potential limit of 0.4 V (SSE) for the dotted curve of Fig. 3.16, the hysteresis of
ζ r between sequential anodic and cathodic steps in the oxide region is small, ψ g,q
keeping constant around 180
o , while in the anodic potential limit of 0.6 V (SSE) for
the solid curve of Fig. 3.16, ζ r exhibits a large hysteresis, accompanying the gradual
changes of ψ g,q from 180
o to around 0
o in the sequential anodic steps up to 0.6 V
(SSE) and from around 0
o to 180
o in the sequential cathodic steps from 0.6 V (SSE).
Particularly, the sign of ζ r changes from minus to plus at about 0.55 V (SSE) in the
sequential anodic steps and from plus to minus at about 0.2 V (SSE) in the sequential
cathodic steps from 0.6 V (SSE) in response to the gradual changes of ψ g,q between
180
o and 0
o .
The plus sign of ζ r with the change of ψ g,q by 180
o in the potential range of 0.6 to
0.3 V (SSE) is associated with the formation of surface PtO monolayer [44, 45]. In
the low potential range of 0.1 to 0.3 V (SSE) within the oxide region, chemisorbed
97
Fig. 3.16 a Real component ζ r and b the phase angle ψ g,q of ζ g,q obtained as a function of potential
for the (111)-textured Pt cantilever electrode in 0.1 M HClO 4 solution, responding to the input signal
amplitude of 50 mV at a frequency of 1 Hz [40]. Reproduced from [40] with permission from The
Electrochemical Society
The sign of ζ r keeps minus in the oxide region during anodic potential scan and
ζ r takes the most negative value (−0.75 V) at about 0.27 V (SSE). In the anodic
potential limit of 0.4 V (SSE) for the dotted curve of Fig. 3.16, the hysteresis of
ζ r between sequential anodic and cathodic steps in the oxide region is small, ψ g,q
keeping constant around 180
o , while in the anodic potential limit of 0.6 V (SSE) for
the solid curve of Fig. 3.16, ζ r exhibits a large hysteresis, accompanying the gradual
changes of ψ g,q from 180
o to around 0
o in the sequential anodic steps up to 0.6 V
(SSE) and from around 0
o to 180
o in the sequential cathodic steps from 0.6 V (SSE).
Particularly, the sign of ζ r changes from minus to plus at about 0.55 V (SSE) in the
sequential anodic steps and from plus to minus at about 0.2 V (SSE) in the sequential
cathodic steps from 0.6 V (SSE) in response to the gradual changes of ψ g,q between
180
o and 0
o .
The plus sign of ζ r with the change of ψ g,q by 180
o in the potential range of 0.6 to
0.3 V (SSE) is associated with the formation of surface PtO monolayer [44, 45]. In
the low potential range of 0.1 to 0.3 V (SSE) within the oxide region, chemisorbed