

4.3 Changes in Surface Stress during UPD
127
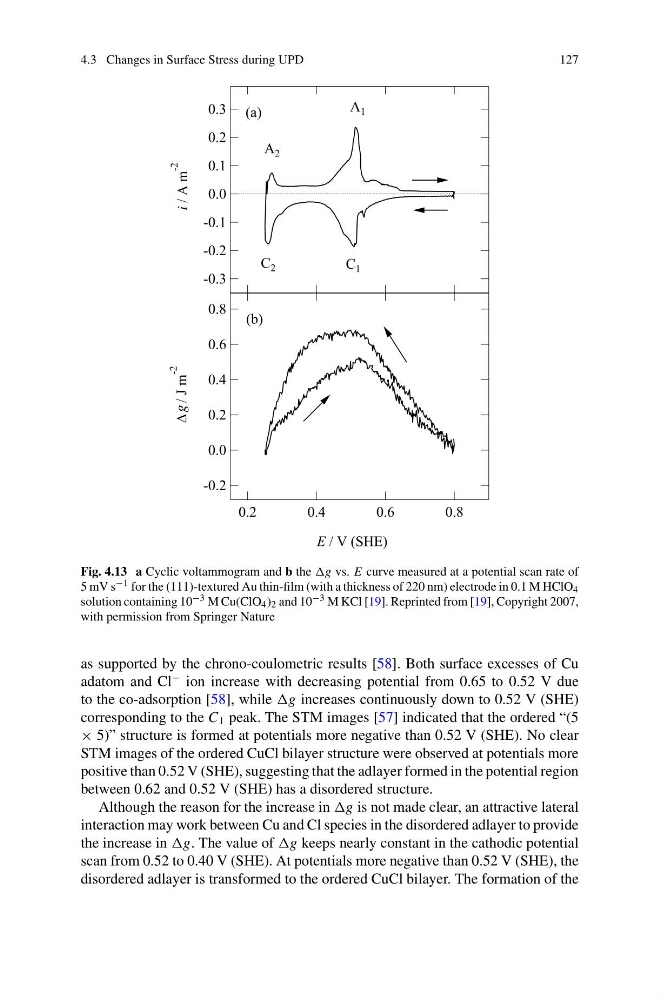
Fig. 4.13 a Cyclic voltammogram and b the vs. E curve measured at a potential scan rate of
5 mV s −1 for the (111)-textured Au thin-film (with a thickness of 220 nm) electrode in 0.1 M HClO 4
solution containing 10 −3 M Cu(ClO 4 ) 2 and 10 −3 M KCl [19]. Reprinted from [19], Copyright 2007,
with permission from Springer Nature
as supported by the chrono-coulometric results [58]. Both surface excesses of Cu
adatom and Cl
− ion increase with decreasing potential from 0.65 to 0.52 V due
to the co-adsorption [58], while increases continuously down to 0.52 V (SHE)
corresponding to the C 1 peak. The STM images [57] indicated that the ordered “(5
× 5)” structure is formed at potentials more negative than 0.52 V (SHE). No clear
STM images of the ordered CuCl bilayer structure were observed at potentials more
positive than 0.52 V (SHE), suggesting that the adlayer formed in the potential region
between 0.62 and 0.52 V (SHE) has a disordered structure.
Although the reason for the increase in is not made clear, an attractive lateral
interaction may work between Cu and Cl species in the disordered adlayer to provide
the increase in The value of keeps nearly constant in the cathodic potential
scan from 0.52 to 0.40 V (SHE). At potentials more negative than 0.52 V (SHE), the
disordered adlayer is transformed to the ordered CuCl bilayer. The formation of the
127
Fig. 4.13 a Cyclic voltammogram and b the vs. E curve measured at a potential scan rate of
5 mV s −1 for the (111)-textured Au thin-film (with a thickness of 220 nm) electrode in 0.1 M HClO 4
solution containing 10 −3 M Cu(ClO 4 ) 2 and 10 −3 M KCl [19]. Reprinted from [19], Copyright 2007,
with permission from Springer Nature
as supported by the chrono-coulometric results [58]. Both surface excesses of Cu
adatom and Cl
− ion increase with decreasing potential from 0.65 to 0.52 V due
to the co-adsorption [58], while increases continuously down to 0.52 V (SHE)
corresponding to the C 1 peak. The STM images [57] indicated that the ordered “(5
× 5)” structure is formed at potentials more negative than 0.52 V (SHE). No clear
STM images of the ordered CuCl bilayer structure were observed at potentials more
positive than 0.52 V (SHE), suggesting that the adlayer formed in the potential region
between 0.62 and 0.52 V (SHE) has a disordered structure.
Although the reason for the increase in is not made clear, an attractive lateral
interaction may work between Cu and Cl species in the disordered adlayer to provide
the increase in The value of keeps nearly constant in the cathodic potential
scan from 0.52 to 0.40 V (SHE). At potentials more negative than 0.52 V (SHE), the
disordered adlayer is transformed to the ordered CuCl bilayer. The formation of the