

7
100
135.18
119.34
%
229.35
107.24
90.40
145.03
183.20 193.18
211.39 215.76
0 80 90 100
110 120
130 140 150 160
170 180 190 200
210 220 230 240 m/z
100
108.94
110.06
1 37.00
%
107.94
121.91
138.00
120.91 135.88
92.97
122.91
233.04
92.10 107.06
1 10.93
139.00
167.93
187.02
167.06
214.96
0
80
95.21
196.00
90 100
110 120
130 140
150 160 170 180 190 200
210 220 230 240 m/z
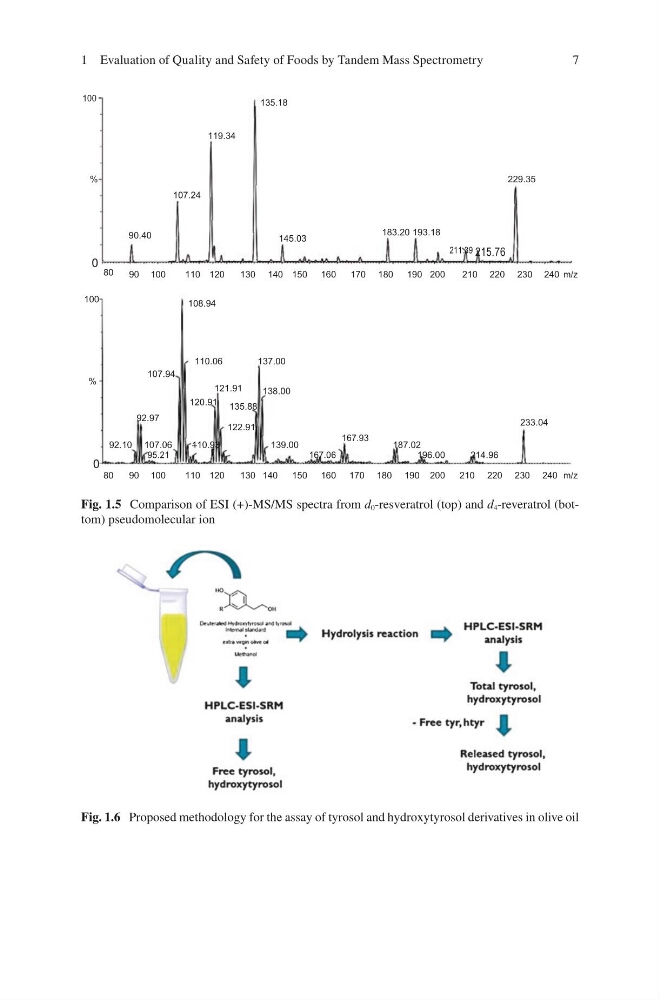
Fig. 1.5 Comparison of ESI (+)-MS/MS spectra from d 0 -resveratrol (top) and d 4 -reveratrol (bottom) pseudomolecular ion
Fig. 1.6 Proposed methodology for the assay of tyrosol and hydroxytyrosol derivatives in olive oil
1 Evaluation of Quality and Safety of Foods by Tandem Mass Spectrometry
100
135.18
119.34
%
229.35
107.24
90.40
145.03
183.20 193.18
211.39 215.76
0 80 90 100
110 120
130 140 150 160
170 180 190 200
210 220 230 240 m/z
100
108.94
110.06
1 37.00
%
107.94
121.91
138.00
120.91 135.88
92.97
122.91
233.04
92.10 107.06
1 10.93
139.00
167.93
187.02
167.06
214.96
0
80
95.21
196.00
90 100
110 120
130 140
150 160 170 180 190 200
210 220 230 240 m/z
Fig. 1.5 Comparison of ESI (+)-MS/MS spectra from d 0 -resveratrol (top) and d 4 -reveratrol (bottom) pseudomolecular ion
Fig. 1.6 Proposed methodology for the assay of tyrosol and hydroxytyrosol derivatives in olive oil
1 Evaluation of Quality and Safety of Foods by Tandem Mass Spectrometry